
Thank You For Requesting The eBook
Please check your inbox for the download link, also check your spam folder
WHAT EVERYBODY OUGHT TO KNOW… ABOUT THIS STOCK TRADING BUSINESS BUT 96% OF THE PEOPLE DON’T
Find Out What And How Knowing Those Will Completely Change Your Perspective Of Profitable Trading
Give Us 30 Minutes And We’ll Show You How To Trade Stock & ETF For Consistent Profitability Without Years Of Hard Work!
96% Of Traders and Investors Struggle And Will Never Achieve Trading Success Without The Right Tools & Techniques
Sadly, 96% of Stock traders and investors will never reach their long desired level of profitability with any level of consistency. It’s not their fault, they just haven’t been taught the right way to pick the right Stock and ETF to trade. It doesn’t have to be this way for you though.
We can show you exactly what you can do to achieve consistent profitability in trading Stock and ETFs using simple logical approach. Please take few minutes to read through the rest of this page to see how you can trade confidently and with peace of mind, and do it much faster and sooner than you ever thought was possible.
Finally…Technology Provides A Quick & Easy Way To Pick Profitable Stocks and ETFs With Mathematical Precision, That Only 4% People Understand And Use
Just less than 4% of people actually understand that consistent profitability in trading and avoiding the pitfalls requires using few simple logical steps, that can be repeated trade after trade, day after day. Of course, you need discipline, correct orientation of mind and a positive expectancy mechanical system that is based on science, mathematics and statistics. Many people simply don’t know the steps or understand these very simple ingredients which make them take many trials and error and eventually fail.
With the advent of sophisticated algorithm, modern computing infrastructure and faster networking, it has now become possible to employ those logical steps far easily than before. The key ingredients in positive expectancy mechanical systems are high-probability trading opportunities, which you can now find quickly without hours of analysing charts and indicators. Technology provides a precision solution for finding those trading opportunities by performing millions of computations over billions of data points in a matter of seconds, right behind your web browser, something that was not available to retail traders till very recently.
There Are Two Criteria That 96% Of The Traders Ignore And Some Traders Are Downright Unaware
Considerations Of These Criteria In Your Trading Decisions Will Have Very Significant Effect On Your Trading Success, Profitability And Peace Of Mind
Let us explain what are these two criteria and how recognition of these criteria could have dramatic effect on your trading results and most importantly, peace of mind.
Please see the table below and see if you can make sense of these numbers and what effect these can have on your trading, it is absolutely critical that you understand the significance of the numbers in the table and what message is ingrained in them.
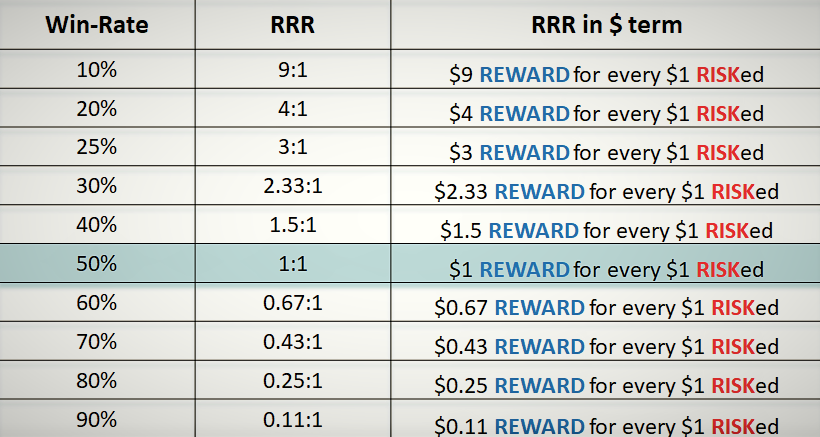
To keep it simple, let’s just look at the highlighted row. But before we do so, let’s define the two column headlines in the table; Win-rate and RRR.
Win-rate is the percentage trades won out of total trades placed. As an example, if you win 8 out of 10 trades, then your Win-rate is 80%.
RRR or Reward-Risk Ratio is the reward or profit made for every $1 risked or one unit in any other currency. As an example, you could look for trades which have RRR of 3:1 or you are looking for $3 reward or profit for a risk of $1.
The highlighted row simply shows that, if you pick trades with a RRR of 1:1, then you need a Win-rate of only 50% to breakeven; breakeven meaning, you will not make any profit or loss from your trading endeavors, ignoring trading commission for simplicity.
This also means that, if you pick trades with RRR of say, 3:1, then you need to win only 25% of trades for breakeven. BUT, if you manage to win any more than 25%, say 80% trades for the same RRR of 3:1, your profitability would sky rocket or off the chart, so to speak.
Here is how: with 80% Win-rate of trades, a RRR of 3:1 and risking $1,000 (or any other currency) per trade, the expectancy is calculated as $2,200 (or in the other currency). This is what is called a strongly positive expectancy in trading.

This Is The Holy Grail Of Trading Stock & ETF
or for that matter, trading in any financial instrument
Obvious question you would be asking is, how can I have high win-rate of my trades.
The answer is simple, you find trades that have high Probability of success.
So, now you know that:
Probability and Reward-Risk Ratio (RRR) The Two Best Friends Of A Trader
Well, it is simple to say that you need to find high Probability trades but questions you would be asking are; what is Probability and how do I know the Probability of the Stock or ETF going UP or DOWN or even trade SIDEWAYS? Let us explain!
Probability is defined as the extent to which something is likely to happen. Probability is a number that reflects the chance or likelihood that a particular event will occur.
For trading Stock or ETF or any other financial instrument, Probability is defined as the chance or likelihood of the underlying Stock or ETF going UP or DOWN or even trade SIDEWAYS. As an example, “I think the Stock XYZ has 90% Probability or chance of going up by 20% in next 45 days.”
If we pick an underlying Stock or ETF that has high Probability of going UP, as an example, we will have very high Win-rate for our BUY or LONG trades (buying a Stock or ETF to profit from BULLISH move). Similarly, If we pick the underlying Stock or ETF that has high Probability of going DOWN, we will have very high Win-rate of our SELL or SHORT trades (selling a Stock or ETF to profit from BEARISH move).
There Are No Loopholes Or Hacks Or Secrets Here As You Might Have Been Led To Believe In Past
Just to make the point clearer to you with an example, if it had rained in the month of December in 9 out of last 10 years, then there is a 90% Probability of rain in Next December. In the Stock market situation, if certain Stock or ETF had moved UP 9 times in past 10 events, then the same Stock or ETF has 90% Probability of going UP in the next event. Similarly, if the Stock or ETF had moved DOWN 9 times in past 10 events, then the same Stock or ETF has 90% Probability of going DOWN in the next event.
It’s Simple Straightforward Probability Which Are Real, Hard And Tangible Numbers Derived From Historical Patterns
Sounds logical? Then, please read on.
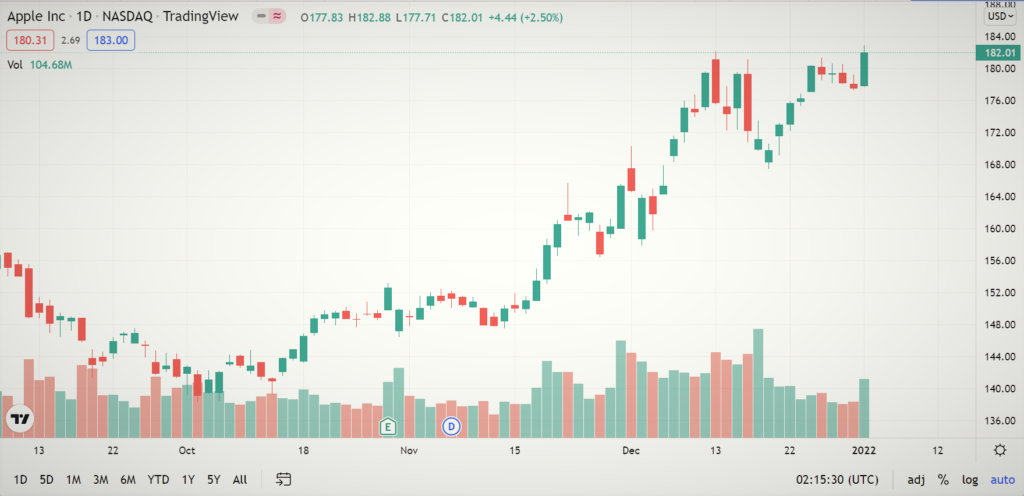
See the chart of a popular Stock below, you could look at any other chart if you would like, for the purpose of this discussion. There are three clear dimensions or aspects in the chart, which are:
1. Time: The price of the underlying Stock or ETF is moving UP or DOWN every trading day, every month, every year and so on;
2. Volume: The trading volume of the underlying Stock or ETF varies every day, some days low, some days high and some days very high compared to daily average; and
3. Price action: Price action is defined as the actual movement of the Stock price plotted against time. In this chart, each red or green candlestick representing one day of movement of the underlying Stock.
Probability of the Stock going UP or DOWN or SIDEWAYS are derived by finding specific patterns in any of these three dimensions of the Stock chart and calculating the frequency of recurrence of these patterns.
If the patterns had occured 80% of the time in past, then there is a 80% Probability of the pattern occuring again. That’s the strengh of the trading system, that you are going to make BUY or SELL trading decisions based on Probability of recurrence of the patterns using historical evidence.
There Is No Need For Hunch Or Guesswork
Calculation of these patterns and their historical performances are extremely computation intensive. Thanks to the advent of modern cloud computing and programming technology, that we can now have these level of analysis and number crunching available to retail traders.
Just a quick word of caution: Probability is not certainty! When you trade with high Probability, there remains a small Probability of the Stock or ETF not going in the direction of your assesment. These are the situations where you would need strict money management to protect your trading capital.
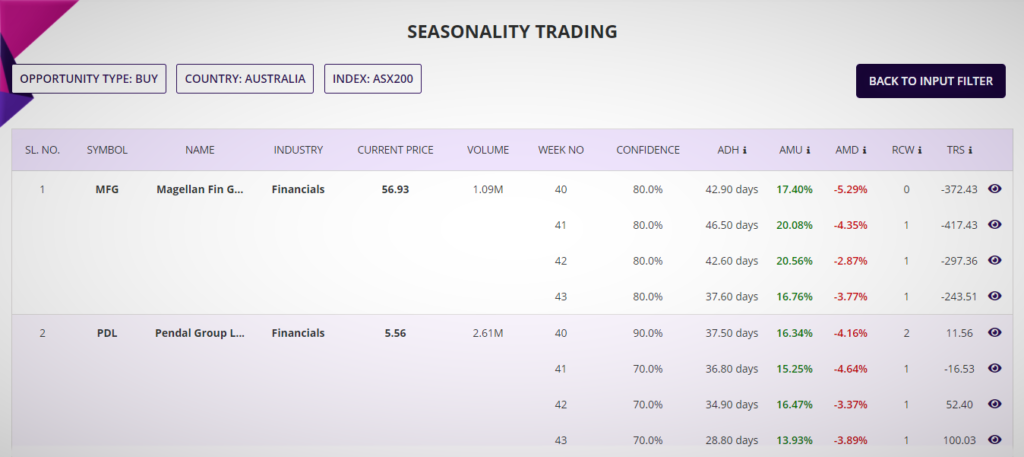
Seasonality Trading
Patterns in Time dimension are the ones which occur every certain days or weeks or any other period in a year. These patterns are called Seasonality of financial market. An example of Seasonality pattern would be like certain Stocks or ETFs going UP only during Week 40 of the year 90% of the time in last 20 years.
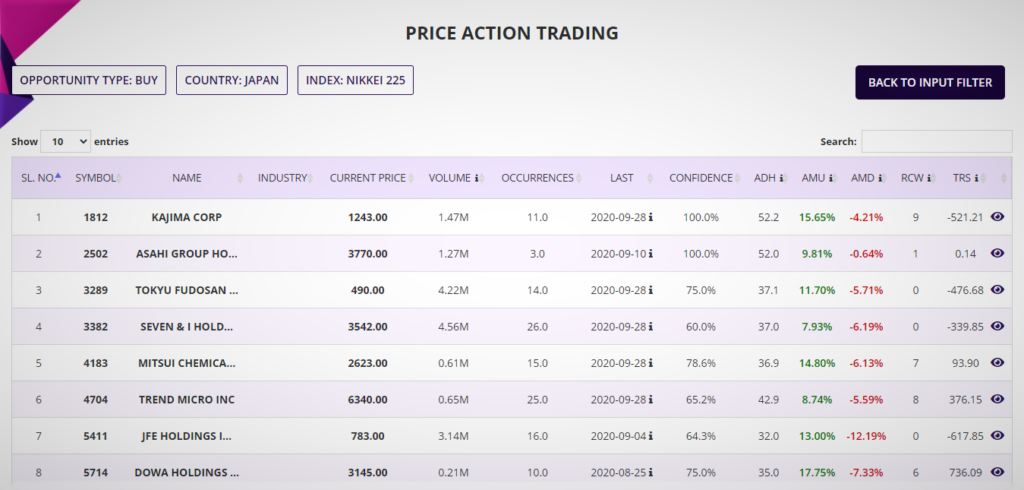
Price Action Trading
Price action patterns are the ones which relate to movement of the underlying Stock or ETF and the corresponding patterns generated by confluence of momentum, trend, volume and few other critical levels.
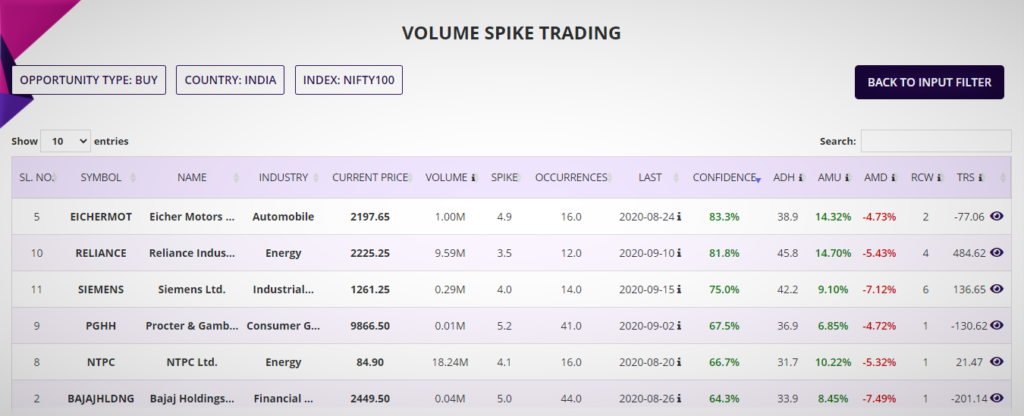
Volume Spike Trading
Patterns in the Volume dimension are the ones which occur after the trading volume of the underlying Stock or ETF spikes to certain level compared to daily averages. As an example, certain Stock or ETF goes UP 90% of the time after the trading Volume spikes up by 3X.
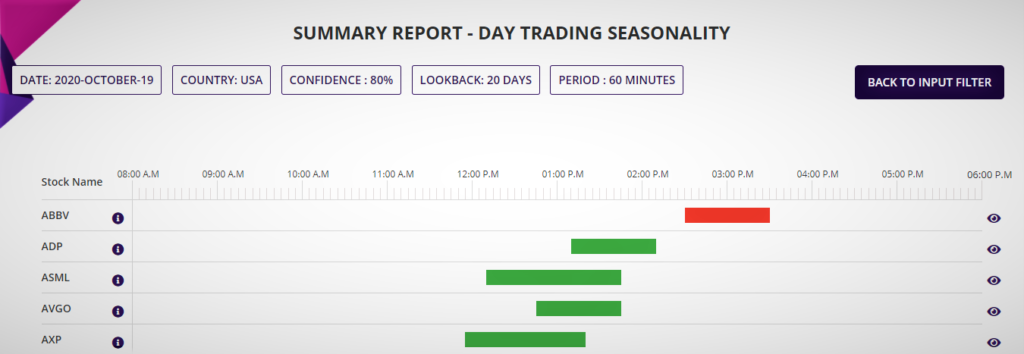
Intraday Seasonality Trading
This relates to the patterns generated by minute by minute movement of the underlying Stock or ETF in a day for Intraday trading.
See What Customers Are Saying About Our Trading Applications

Which Country's Stocks And ETFs Do You Support?
Seasonality, Price action and Volume spike trading applications are currently available for all the Stocks in the major Indices and ETFs of the following countries in four continents:
Asia: India, Singapore, Philippines, Japan, Hong Kong, Taiwan, Malaysia and China;
Europe: UK, Germany, France, Austria, Italy, Poland, Netherlands, Sweden, Switzerland, Spain, Portugal, Norway, Luxembourg, Ireland, Greece, Finland, Denmark and Belgium;
Oceania: Australia and New Zealand; and
The Americas: USA, Canada, Brazil, Chile, Mexico and Peru;
This makes up to about 20,000 Stocks and ETFs across 40 indices in more than 30 countries.
Intraday Seasonality trading application is currently available for top 50 to 100 Stocks from the following countries: Australia, India, UK and USA. The top Stocks mean the Stocks with the top market capitalization and the highest weightage in the main index of the countries.
For USA, the underlying also include the top ETFs by market capitalisation such as SPY, DIA, EEM, GLD and the likes.
Your Top 3 Questions And Concerns Answered!
What's in it for me?
Everything about trading, frankly! Apologies, if it sounds arrogant to you. 96% of traders use either tips from others (mostly via social media) or hunch or recommendations from brokers or some kind of technical/fundamental analysis, almost none with any sound logic or backed by a system involving any back-testing or statistical analysis of probability, for making their trading decisions. Using a trading system of applications to pick Stocks and ETFs based on sound mathematical and statistical models, you will be making trading decisions with confidence knowing that those are backed by historical evidences. Coupled with proper sizing of trades and picking opportunities with better than 2:1 Reward-Risk Ratio, you will have peace of mind and avoid the emotions associated with trading.
Why do I need these for my trading?
Traders in financial markets or self-directed investors of any persuasion, whether trading Stocks or ETFs or bonds or currencies or futures or any other derivatives or whether intraday trading or swing trading, require a mechanical system with positive expectancy to trade that can be repeated day after day for consistent profitability. Expectancy is a measure of reliability of a trading system and uses a formula involving Probability of win, average size of win (reward) and average size of loss (risk). Always a good mechanical system should be accompanied by proper sizing of the trades (engaging only a small % of trading capital) and RRR of more than 2:1. Irrespective of what you trade, these are the basic ingredients of successful trading that you simply can’t do away with. Our applications provide a solid mechanical system of trading that are founded on scientific methods and uses mathematical and statistical models to pick Stocks and ETFs using historical patterns. Using this mechanical system with discipline and correct orientation of mind, you are set up for successful trading.
Why should I subscribe these services from you?
We are traders ourselves and managing our own funds by trading in financial markets and investing in other assets is our main business. During early days of our trading in Stocks and CFDs, we used several systems and always looked for ones that are based on historical evidences for Probability or in other words, a system with built-in back-testing so we know how did they perform in past and the likelihood of their repeat performance. With that in mind and years of research, we pulled together the algorithms for these trading applications, looking at various aspects of a technical chart such as time, volume and price action. The foundation of these trading applications is based on identification of patterns in these three aspects of the chart. Existence of various patterns and their historical performances in form of confidence became the basis of our decision making and continues to do so. The same tools and applications are now being made available to traders so that traders could make their own decisions based on a sound mechanical system rather than subjectively.
Any other query or concern, please get in touch with us at info@sapphirecapitals.com.
FAQ
No, Seasonality, Price action, Volume spike and Intraday Seasonality are web-based trading applications. They provide “Confidence” of recurrence of patterns, which is also the Probability of success of a trade based on various input criteria you will provide. Please visit the tutorial pages for each of these applications and also watch the tutorial videos for better understanding of how these trading applications work.
You will need a computer with web browser, internet connection and subscription of the services to access these trading applications. You may subscribe to one or more of these applications and each application has its own URL. It is recommended that you bookmark these URLs in your browser for ease of accessing.
Please note that there is no software download and installation required.
You may run the applications as often as you like, there are no set or preferred time. It is recommended that you run Seasonality trading app during the weekend as the summary reports provide Stock and ETF to trade on the following Monday and lists those by week number. Price action and Volume spike applications are preferably run once everyday. Intraday Seasonality app is also recommended to be run daily, preferably 4 hours after the close of trading of the day for reports of Stocks for next day trading.
At any instant of time, you may run the trading applications for all the Stocks or ETFs of one Index of one country only. As an example, you pick the country as UK, then you can run the report for all the Stocks of one of the indices, such as FTSE100 or FTSE250. On completion of that report, you may run the application again for the US Stocks in Indices such as DOW30 or S&P500.
Disclaimer
Trading in Financial markets has large potential rewards, but also large potential risk. You must be aware of the risks and be willing to accept them in order to trade. Don’t trade with money you can’t afford to lose. This is neither a solicitation nor an offer to Buy/Sell any of the financial instruments mentioned in Sapphire Capital’s training program and the trading applications.
No representation is being made that any account will or is likely to achieve profits or losses similar to those shown. The past performance of any trading system or methodology is not necessarily indicative of future results.
The information provided by these trading applications are for educational and research purposes only and are not intended to provide financial advice. Any statements about profits or income, expressed or implied, do not represent a guarantee. You accept full responsibilities for your actions, trades, profit or loss, and agree not to hold the author responsible in any and all ways.
Sapphire Capitals is NOT a financial services company as defined by the Australian Securities and Investment Commission (ASIC) or any similar organisation anywhere else in the world as:
- We do not provide financial product advice to our customers;
- We do not deal in a financial product such as buying or selling shares on behalf of a client or issuing interests in a managed investment scheme;
- We do not make a market for a financial product; and also
- We do not operate a registered managed investment scheme.