
Volume Spike Trading App
Tutorial
In this page, we will walk you through the details of Volume spike trading app and how to use it for your trading decisions. The app is fully web-based running in a cloud VPS server and hence there is nothing to dowload or install. All you need is the subscription to the app, a computer with web browser and an internet connection. If you do not have subscription for the services, get it here.
Important: This and all our other trading apps are extremely computation intensive as they perform millions of calculations to bring you the results of analysis and it may take from seconds to several minutes depending upon the size of the Index on which the analysis is being run. As an example, an index of 500 Stocks will take more time than the index of 30 Stocks. So, please be patient after you click the Submit button.
Please note: Although we may have used examples from one or two countries and couple of indexes in this tutorial, but the app is available for Stocks and ETFs from over 36 countries in 4 continents (Asia, Europe, Oceania and Americas) covering more than 150 indexes and over 45,000 Stocks and ETFs.
Volume Spike Trading app - Getting started
The Volume spike trading app can be accessed in one of the three different ways. First, from the Sapphire Capitals main portal’s Volume Spike Trading App page; Second, from your Sapphire Capitals’ account dashboard page; and third, from a new tab in your web browser, all are described below.
Log in to you Sapphire Capitals account
Before you start using the app, you will need to login to your Sapphire Capitals account. Go to the Sapphire Capitals portal at www.sapphirecapitals.com and click on LOGIN at the upper right corner of the page to go to the login page. The login page appears like below.
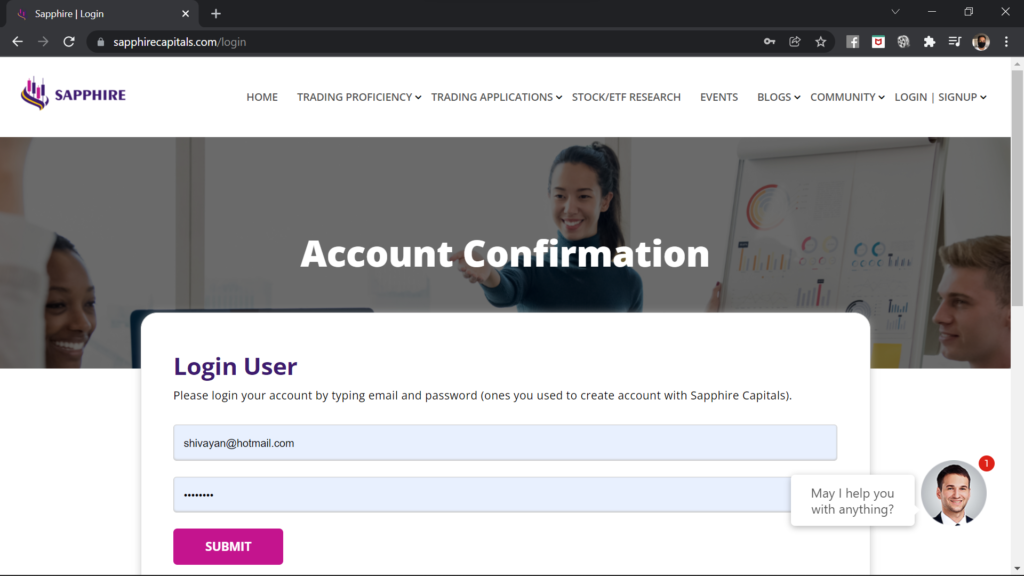
Please login with your email and password, if you already have an account with Sapphire Capitals. If you are a new subscriber, you would have received a temporary password with the welcome email after you had subscribed the service. You can login using your email and temporary password. It is recommended to change the password to a new one that you can easily remember and only known to you.
Once logged in, the Login/Signup menu at the top right corner is changed to an icon as shown in the image below.
Launch App from Sapphire Capitals main portal's Volume Spike Trading App page
Launch App from Sapphire Capitals main portal's Volume Spike Trading App page
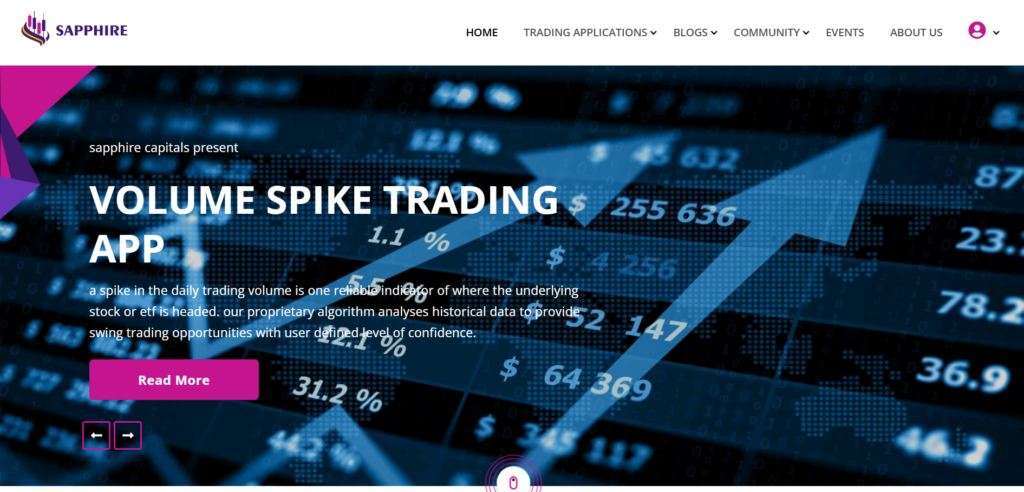
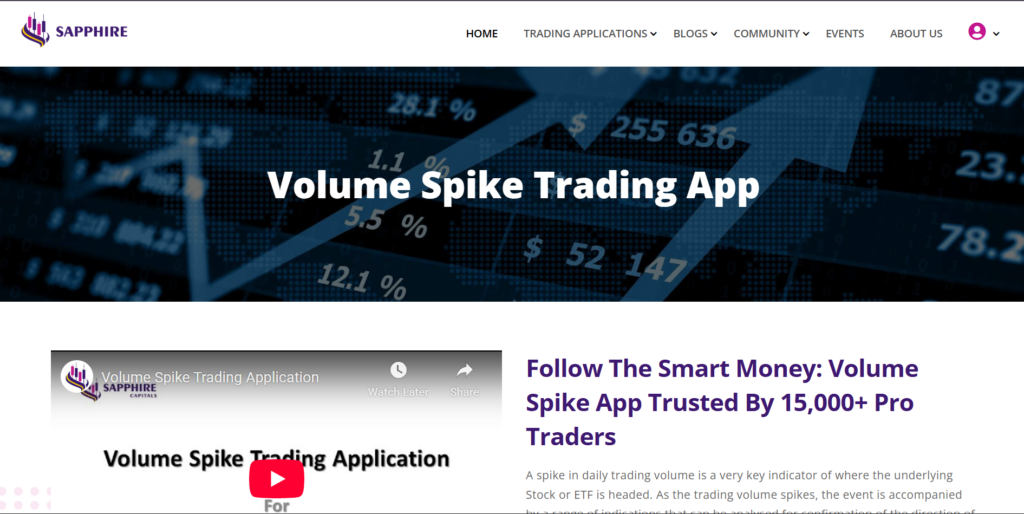
Please go to the top of Sapphire Capitals portal and from the pull down menu under TRADING APPLICATIONS, select Volume Spike Trading. This will take you to the Volume Spike trading information page as shown below.
In the Volume Spike trading information page, please scroll down to the bottom of the page. The bottom of the page should look like this, as shown in the image below.
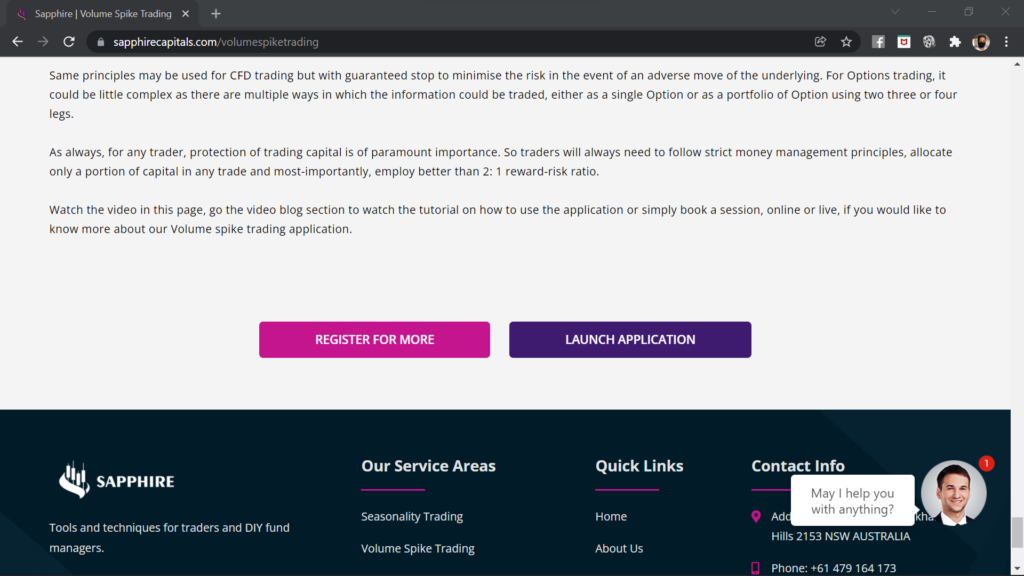
Please click the deep purple button “LAUNCH APPLICATION” which will open a new tab in your web browser with the Volume Spike Trading app’s input (filter) page.
Launch App from Sapphire Capitals user account dashboard
Launch App from Sapphire Capitals user account dashboard
Go to the top right corner of the Sapphire Capitals portal. Since you are already logged in, a dropdown menu will appear when you click the down arrow button. In the drop down menu, you will see the Dashboard option.
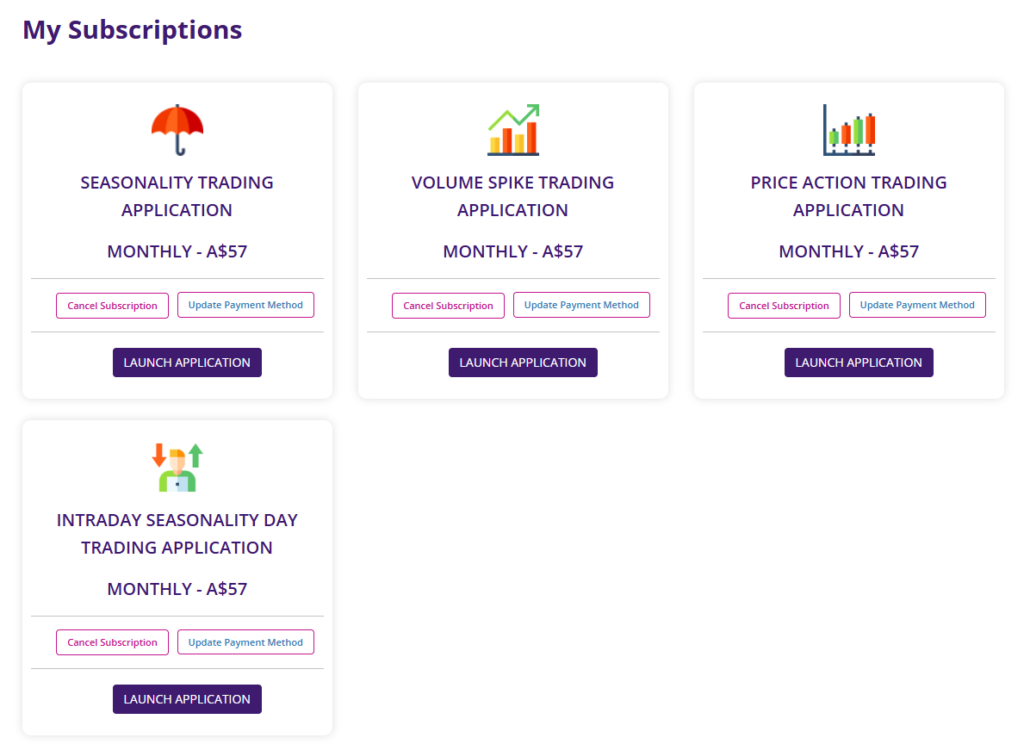
Clicking that option will take you to a page which looks something similar to the following, depending upon your current subscriptions. If you are only subscribed to Volume Spike Trading app, then only that item will appear on the dashboard.
Launch App from a new browser tab
Launch App from a new browser tab
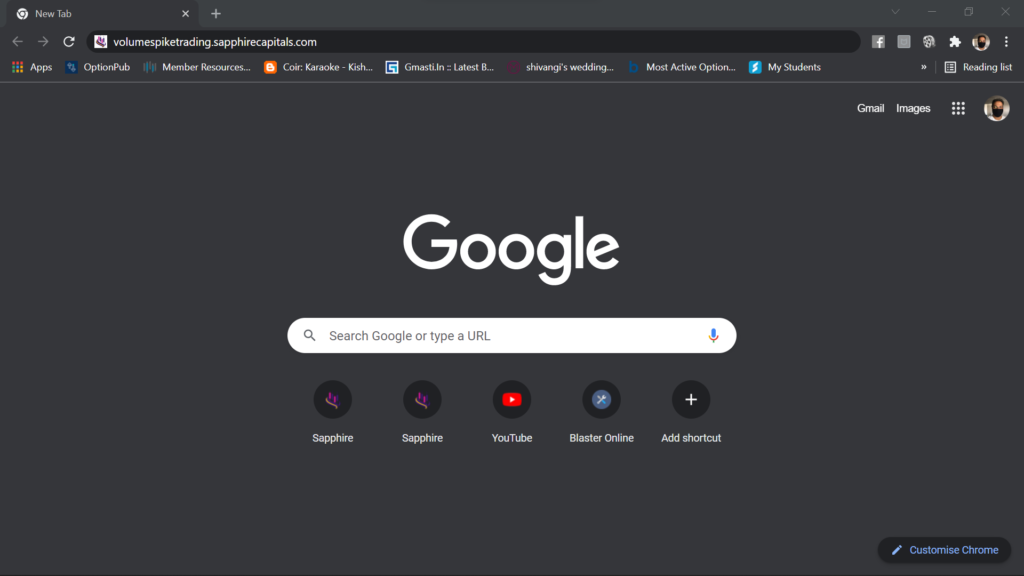
Finally, you may also open your browser or open a new tab in your web browser and type the following URL volumespiketrading.sapphirecapitals.com as shown in the image below. If you are already logged in to Sapphire Capitals portal in your computer, it will open the app’s input page.
If you are not logged in, it will ask you to login with your email and password as mentioned earlier. After clicking the SUBMIT button on the login page, it will open the app’s input page.
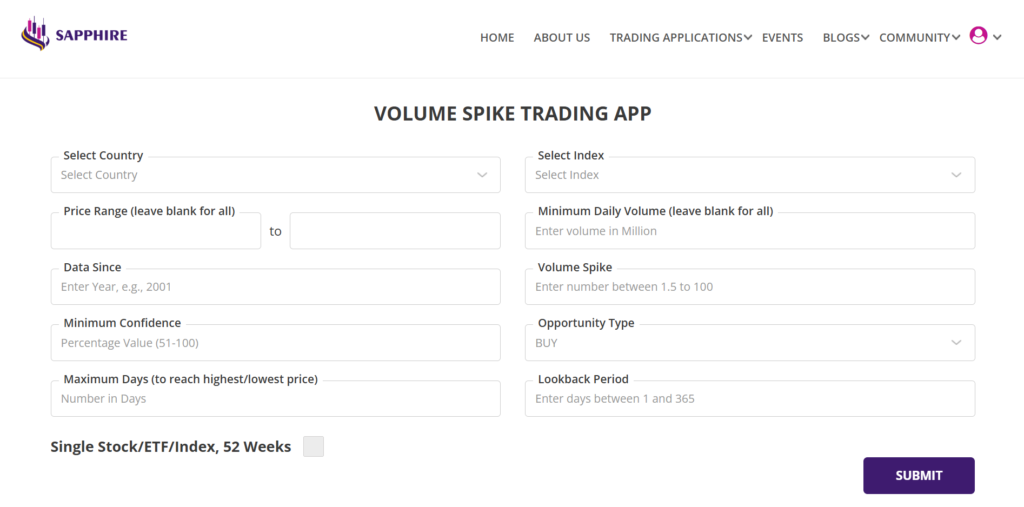
Whichever way you launch the app, you will see the following screen.
Input to the Volume Spike Trading app
The Volume Spike trading app input page has two separate input sections, as explained below, depending upon how do you want the analysis to be performed by the app.
Main input section of the app
A total of 10 input parameters, some mandatory and some optional, make up the main input section of the trading app. This is the input section you will use most of the time as this is intended for finding positive expectancy trading opportunities with Stocks in an index or the major ETFs of the country of your interest.
Full details of the parameters for this input section are described in a little while.
Single Stock/ETF/Index, Premium service
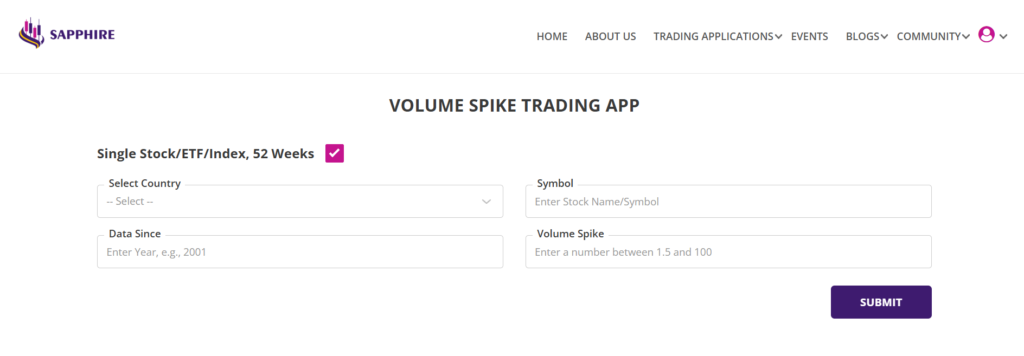
If you are looking to analyse only one Stock or ETF for volume spikes over a period of time such as one year or two or more years, you will use this input section. This is enabled by ticking the box next to “Single Stock/ETF/Index, Premium service“. The input screen switches to a different format as shown in the image below.
Please note that, this optional feature is currently in Beta version (in trial phase and not fully ready for commercial release) and may not be available to your subscription. However, if available to you, please do play with this feature of the app and provide feedback to us.
Inputs to the Volume Spike Trading app - main section
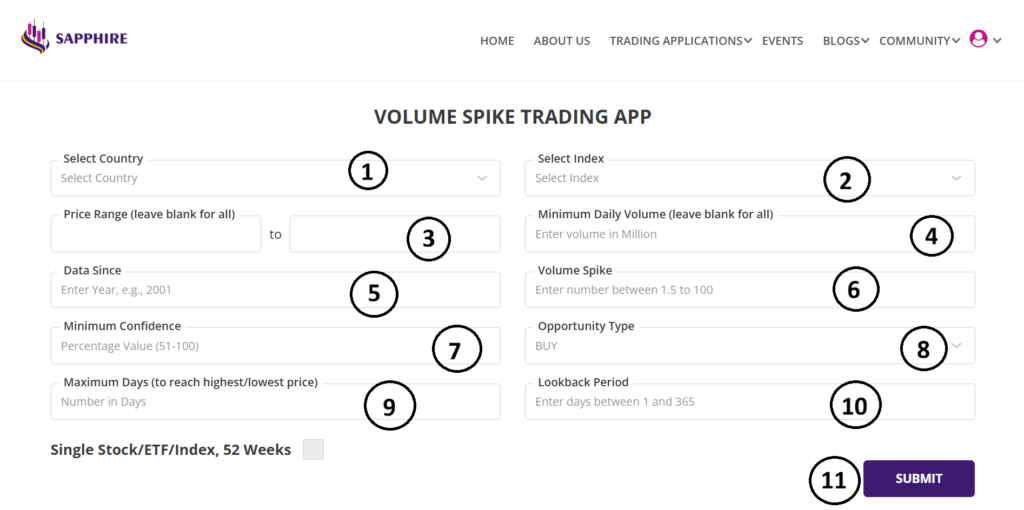
The main input section has 10 filter criteria marked from 1 to 10 followed by a submit button at 11 as shown in the image below.

The input filter criteria are as follows:
1. Select Country: Based on your subscription, you would be offered the selection of countries from the pull down menu. If you subscribe to multiple countries, then you will be able to select one of those countries from the pull-down menu for running the app, you can run the app only for one country at a time.
2. Select Index: The app can be run one Index at a time for the selected country. If the selected country has multiple indexes or pre-configured list of Stocks and ETFs, you will be able to pick one of those Indexes or lists from the pull down menu for running the app.
3. Price Range: This is an optional parameter. If you want to look for Stocks or ETFs only within certain price range, then select the range in these two boxes, the left being the lower range and right box being the higher range. As an example, if you want to look for Stocks or ETFs above certain price, then only input the lower range parameter leaving the higher range blank. If you want to see for all Stocks or ETFs, then, leave both boxes blank.
4. Minimum Daily Volume: This is an optional parameter. If you want to only find Stocks or ETFs with daily trading volume above certain number, then type in the number in this box in millions. As an example, if you would like only to trade highly liquid Stocks or ETFs with minimum daily trading volume of 1 million, then type in “1” in this box. If you want to see all Stocks or ETFs irrespective of their trading volume, then leave this input blank.
5. Data Since: This mandatory input is for the number of years for which you would like the app to perform the Volume Spike analysis. As an example, if you are running the app on 1st June 2025, then an input of 2021 will mean that the analysis will be performed for a period beginning 1st Janury 2021 till date or 31st May of 2025. It is recommended that the volume spike study is performed for a period of 2 to 4 years, as any longer period would not reveal any additional useful information.
6. Volume Spike: This is a mandatory input. You can select the size of the volume spike by this input, type in the size of the spike you are looking for in this section. The range is from 1.5 to 100, for 1.5 times to 100 times the size of the volume compared to daily average volume. If you input 3, the app will look for volume spikes of size 3 X or 3 times the average daily volume and above.
7. Minimum Confidence: This is a mandatory input. This input filter is the minimum probability that you would like to trade with. In the app, Confidence is calculated as the % of times when the underlying Stock or ETF made a bullish or bearish move, depending upon the selection of Opportunity Type following a volume spike, to the total number of volume spikes during the analysis period as determined by “Data Since”. If you are looking for Stocks or ETFs with 90% confidence for BUY opportunities, then the same Stocks or ETFs will have a 90% probability of being bullish after the next volume spike. Similarly for SELL opportunities.
8. Opportunity Type: Default is BUY. If you are looking for bearish trading opportunities (to profit from falling price of the Stock or ETF), then select SELL.
9. Maximum Days: This is an optional input. If you are looking for Stocks and ETFs which reached the highest price (for BUY Opportunity Type) or lowest price (for SELL Opportunity Type) within certain number of days, then type in the number of days in this box. Leave it blank to ignore this filter.
10. Lookback period: This is mandatory input to the trading app asking it to find volume spikes across all the Stocks in the Index or list of ETFs in last so many days. As an example, if you type in 7 for 7 days, then the app will only find Stocks or ETFs which had volume spikes in last 7 days. To trade an underlying Stock or ETF, you would like to know as soon as volume spiked, so you might like to keep it to 1 day or 2 days at most. This is because any event older than 3 to 4 days may not be useful for trading purposes. However, we recommend that you use 7 to 30 days for this input, so that you could see how many times volume had spiked in the broader market, what are their confidences and then pick the ones that you would like to study little more closely.
11. SUBMIT button: Click this button after you have provided all the mandatory inputs and any other optional inputs.
Things you might like to know: The Volume Spike Trading app is one of the most computation intensive and executes millions of calculations using the inputs you have provided on the selected Stocks and ETFs. It uses a set of proprietary algorithm to validate the volume spike after it has identified one, each of which involves execution of thousands of lines of codes over millions of data points. We have implemented the best of technology to leverage the available computational power to bring the results of analysis fast. It will take several seconds to perform the complete computation and the time is dependant upon the number of Stocks or ETFs in the selected index or list.
As an example, analysis of 500 Stocks in S&P500 index will take more time than 100 Stock NASDAQ index or 300 Stocks ASX300 will take more time than 100 Stocks ASX100 and likewise.
Summary report - Volume Spike trading app
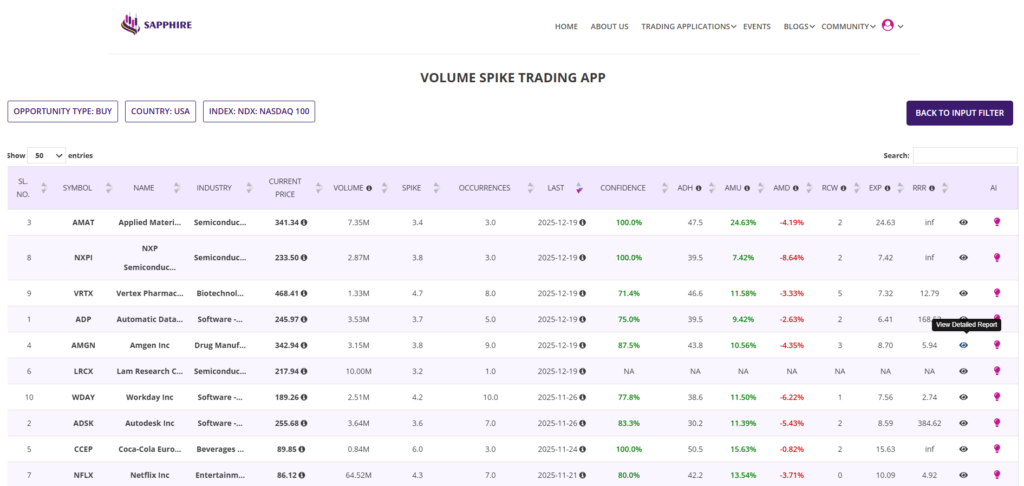
On completion of the analysis, the summary report is presented as shown in the image below.

Summary report can run into several pages depending upon your inputs as well as the size of the Stock index or the number of ETFs you selected for study. Please scroll up and down to review each row before you pick one or more of the Stocks or ETFs to drill down for further analysis.
You may also select how many rows of Stock or ETF to be displayed in one page by clicking the down arrow button on the top left side of the summary report.
Please note:
The report pages (both Summary and Detailed report, to be discussed little later) tries to automatically adjust to the screen size of your computer monitor based on your computer’s setting. But sometimes it is possible that report page is larger or smaller than your computer screen and some parts of the report and/or menu may be obsecured from view or look staggered or too small to read. If that happens, please press the “Ctrl” button of your Windows computer and while gently rolling the mouse wheel to adjust the size of the report to fit your computer’s screen size for full visibility. If you are using a Mac computer, try option + command + mouse wheel for same results. If that does not work, you may need additional setting changes in your Mac, check with your computer’s manual.
Understanding the summary report
Let us break it down for you so you know what summary report contains and how to interpret the information provided in various sections of the report.
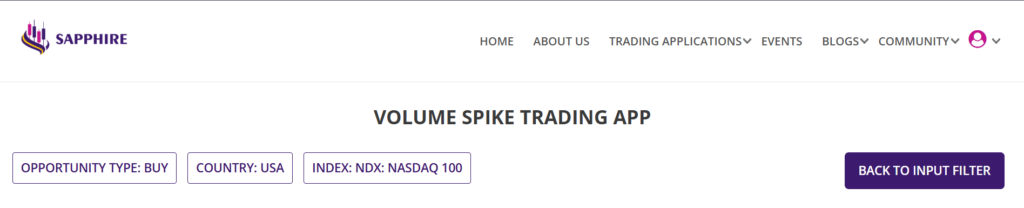
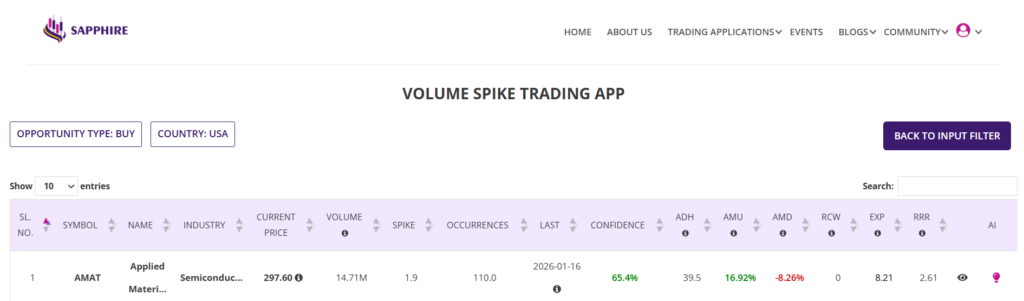
First up, to keep you informed, the top of the summary report shows you the opportunity type, country and index used for the analysis, see the image below.
The summary report consists of several columns of information for each row of Stock or ETF as shown in the image below. All these columns of information can be sorted alphabetically or by number or by dates as the case may be, depending upon the information type in those columns. Click on the column heading to sort.
The columns SYMBOL, NAME, INDUSTRY, CURRENT PRICE and VOLUME are self-explanatory and respectively provide the information on the Stock or ETF symbol, the company or underlying name, the industry to which the Stock or ETF belongs to, the last traded price and the last volume traded.
Also hovering mouse over “i” near the underlying Stock to ETF price will tell you about the date on which this price was recorded. In other words, it tell you about the freshness of the underlying’s price when you run the app. Usually, the Stock and ETF prices are updated in our system about 4 hours after the stock exchanges close regular trading.
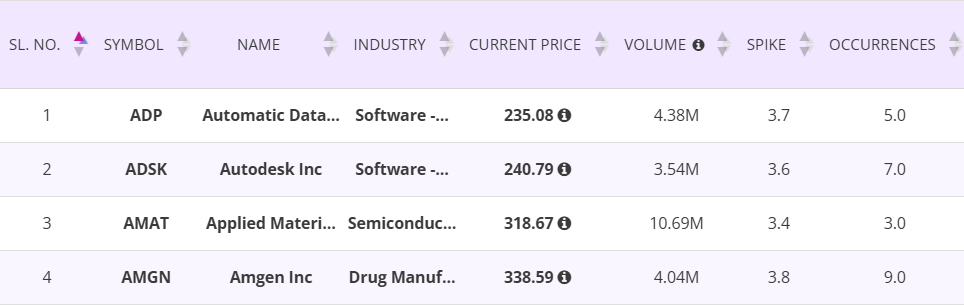
For some countries, the SYMBOL, NAME of the company and the INDUSTRY are abbreviated, as shown in the image above, because of how much screen real estate is available to display all the information. Hovering the mouse over the abbreviations will reveal the full text.
The other columns are SPIKE, OCCURRENCES, LAST, CONFIDENCE, ADH, AMU, AMD, RCW, EXP and RRR, each of these are described below.
The number in SPIKE column is the average size of the volume spike of the Stock or ETF over the analysis period, based on the “Data Since” input. In this example, the Stock ADP had an average spike size of 3.7X for period beginning 1st January 2021 till date.
OCCURENCES is the number of times the volume spike event had occured for that underlying Stock or ETF. In this example, the app was run with “Data Since” of 2021. So, the number 5.0 in this column represents the number of times the stock ADP had volume spikes since 1st January 2021 till date, see the image below.
The date in the column LAST is the date when last the volume had spiked for that Stock or ETF, the minimum size of the spike being what you had set in the input filter page. In this example, the stock ADP had it’s latest volume spike on 19 December 2025.
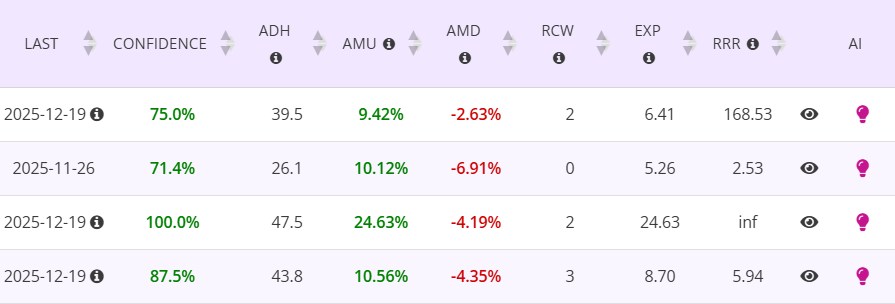
Column CONFIDENCE is the probability of the Stock or ETF making bullish or bearish move following the volume spike, based on your desired Opportunity Type, for trades initiated next day after the volume had spiked.
In the summary report shown below, the example Stock AMGN has 87.5% probability of making bullish move (BUY) following the last volume spike on 19th December 2025. This is because, among the closed trades, 87.5% were profitable as the Stock had made bullish move following the volume spike. Please note that, depending upon when last the volume had spiked for the Stock, not all trades taken after those spike would be closed; only the ones which had occured more than 9 weeks ago would be closed as the app considers 9 weeks trading period following the volume spike. We will look into this in more details when we discuss the detailed report.
For the same example stock AMGN, among the closed trades, the Stock had moved UP by an average of 10.56% (AMU or average move up) and moved DOWN by an average of 4.35% (AMD or average move down). Stock had to be held for an average of 43.8 days (ADH or average days held) for it to reach the high levels following the volume spikes. You would be expecting to take profit around those many days after opening the trade, if not sooner.
Similar information is provided for all the stocks listed in the summary report as shown in the image below.
Please note that the summary report lists only 10 Stocks or ETFs when the app is run, even if there are more than 10 Stocks and ETFs in the report. You may reveal more Stocks or ETFs in the page by selecting the maximum number of Stocks or ETFs to be displayed in the page from the pull-down menu in the upper left corner of the summary report table.
There are two more columns, which provide additional information about what followed the Volume spike, as described below. There are some column header with an “i” next to it, hovering the mouse over the “i” provides definition of those headers.
RCW is Recent Consecutive Wins, gives you an insight of how Volume spike events played out in recent years or the number of successive wins up to the last trading opportunity.
EXP is Expectancy which would be positive as we are looking for trades only with positive expectancy for long term and sustained profitability. The formula to calculate expectancy uses win rate and reward-risk ratio, both of which are first derived by the app from historical analysis and then expectancy is calculated. Note, win rate is same as Confidence or Probability in the app.
The formula for expectancy is EXP = (Win rate X Average wins) + ((1 – Win rate %) X Average loss), for those who are keen to know.
RRR is Reward-Risk ratio. This is also calculated by the app from the historical data after analysing the Volume spike events in the past data as inputted by you.
There are two more columns, one is with a symbol of an eye and the other being AI. Clicking the eye button in the row for each Stock or ETF provides the details report, to be discussed shortly.
Clicking the AI button opens up a new tab in your browser, intended to provide advanced AI analytics covering fundamentals, market sentiments and broker recommendations to compliment the analytics provided by the trading app. This is an upcoming feature, expected to be available shortly, we will keep you updated on its availability.
Pro Tip
Remember, Probability and Reward-Risk Ratio (RRR) are your best friends and your best weapon for predictable and consistent profitability while trading as these two are basis of positive expectancy. We have repeated this mantra several times across various pages of our website and communications, a doctorine that you would like to frame and always be mindful of before making your trading decisions.
While you will pick the Stock or ETF with certain minimum level of confidence but you will need to look at AMU (Average Move Up) and AMD (Average Move Down) very closely as well. For BUY opportunities, you would look for Stocks and ETFs that have AMU of at least 2X of AMD. Similarly, for SELL opportunities, you would look for Stocks and ETFs that have AMD of at least 2X of AMU.
Also, looks for Stocks and ETFs with high RRR. Higher the RRR, better it is for your long term trading success. So, please be mindful of AMD and AMU while picking the underlying Stock and ETF to trade, and with higher than RRR of 2:1.
Detailed report - Volume Spike Trading app
The last column in the summary report has an eye icon, see right most side of the last image in the section above. Click on the icon for a detailed report for the Stock or ETF. The detailed report opens up in a new tab of your browser.
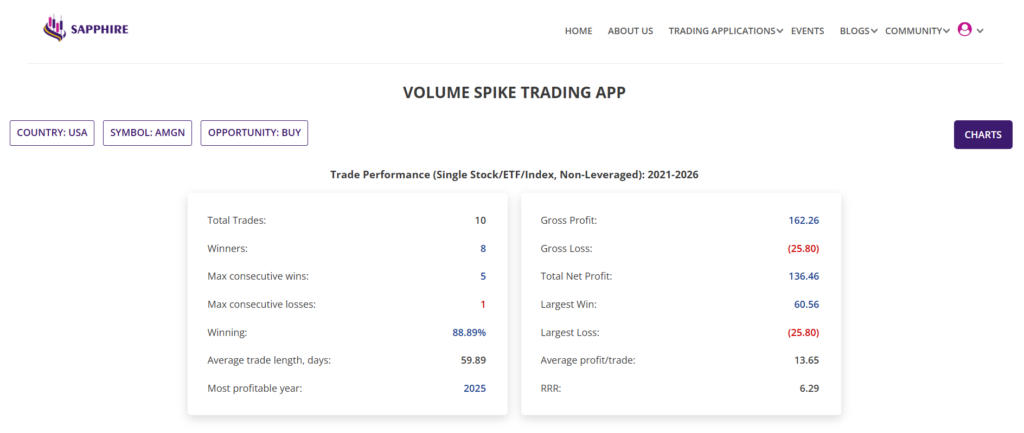
Since you could potentially have multiple detailed reports open for various Stocks or ETFs, the top of the detailed report shows which detailed report are you looking at, see image below. Those include Country, Index, the Symbol of the Stock or ETF being looked into and Opportunity type.
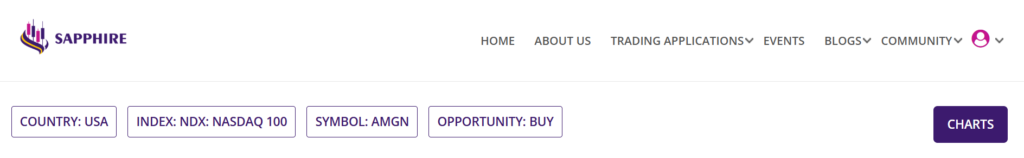
In this example, you are looking at the detailed report for all bullish (BUY) trades following spikes in trading volume during the period of analysis for the Stock AMGN belonging to USA stock index NDX or NASDAQ 100 (All).
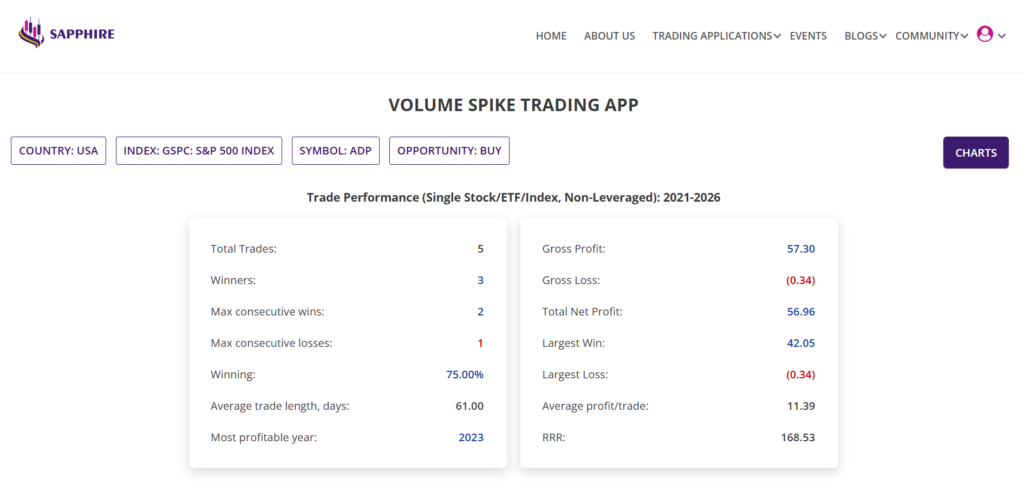
As with our other swing trading apps, the detailed report of Volume Spike trading app also has two different sections providing two different sets of information. In the image below, you have the top section named “Trade Performance (Single Stock/ETF/Index, non-leveraged)“.
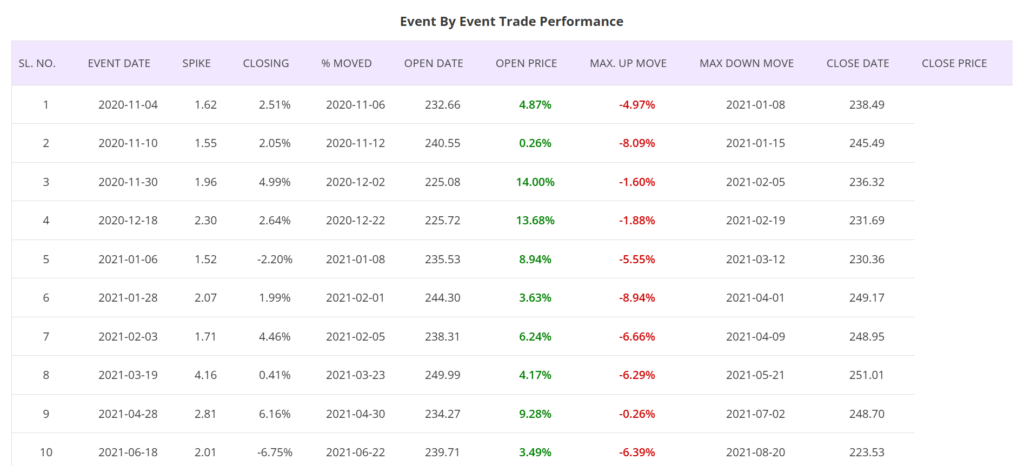
The bottom section of the detailed report is as shown in the image below. It is the “Event By Event Trade Performance” report, we will explain subsequently.
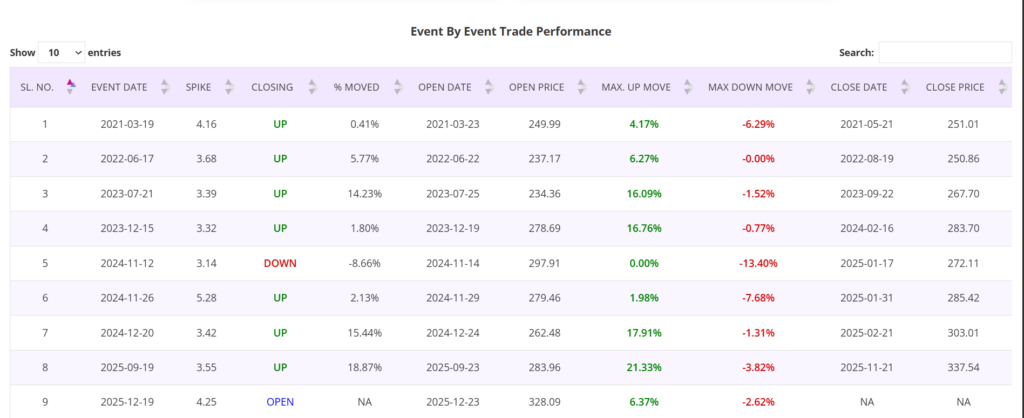
The Event by Event Trade Performance section in the detailed report initially shows only 10 rows for 10 volume spike events per page or fewer depending upon the number of volume spikes occured during the analysis period. In this example, there are only 9 volume spikes for the period analysed, though. If there are more than 10 such volume spike events in the detailed report, you can reveal more lines by setting the maximum number of lines to be displayed per page from the pull-down menu at the top left corner of the section.
The columns in the detailed report can also be sorted, as shown in the image below, based on how are you going to analyse various lines of the report. More details little later.
Understanding the detailed report - Trade Performance
This is the top section of the detailed report, see the image below. The section provides a snapshot of all the trades, if taken two days after every spike in trading volume of the Stock or ETF during the analysis period. Two days after the volume spike is because of the additional validation algorithm running the day after the volume spike. In this tutorial example, we inputted 2021 as “Data Since”, so the analysis period was from 1st January 2021 till date. For simplicity, there is no commission assumed as commissions do vary and some brokerages do not charge any commissions! Also, most certainly, you would be trading more than one Stock or ETF per trade which will affect your commission and net profit from the trades.
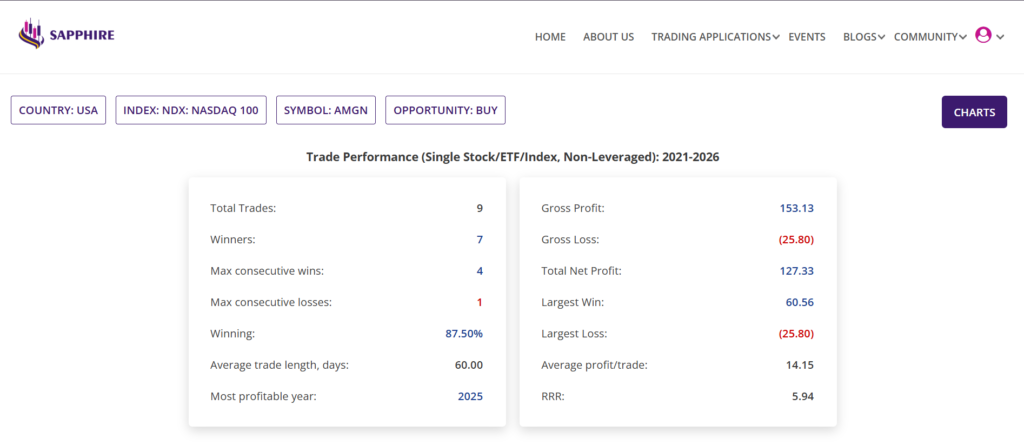
In the left side of the section, in the image above, Total Trades, Winners, Max consecutive wins, Max consecutive losses are self explanatory. The total trades in this table includes the trades which are still OPEN. Open trades are the ones where 9 weeks period has not elapsed since opening the trade following last volume spike. So, Winning is calculated as the number of winners divided by the total number of CLOSED trades. More details on OPEN and CLOSED trades shortly.
Winning is the Confidence as defined earlier, which is also the probability you are looking for. Average trade length is also the ADH or Average Days Held as in the summary report. And lastly, the section includes the Most profitable year, or the year in which the underlying Stock or ETF made the largest move, either bullish or bearish, depending upon your choice of Opportunity type.
The right hand side of the section above shows the trade performance in terms of the underlying currency of the Stock or ETF. As an example, if you are looking at European Stocks or ETFs, then the numbers in this section will be in EUR. Or if you are looking at Indian Stocks or ETFs, then the numbers are in INR and so on. In this example though, the currency is USD as we are looking at Stocks from an American stock exchange.
Continuing with the same example, the Gross Profit from 7 winning trades is 153.13, Gross Loss from 1 losing trade is 25.80, resulting in a Total Net Profit of 127.33 with an Average profit/trade of 14.15. The Largest win in those trades was 60.56 and Largest loss was 25.80. Please note that, for the purpose of calculation of the numbers mentioned above, only CLOSED trades (8 out of the 9 total trades) were considered as one trade is still open.
Please note that RRR is forward looking, meaning you would like to achieve a minimum RRR of 2:1 in your trades whereas RRR shown by our app is a number derived from historical trade performances. As such, this number could also be called Profit factor.
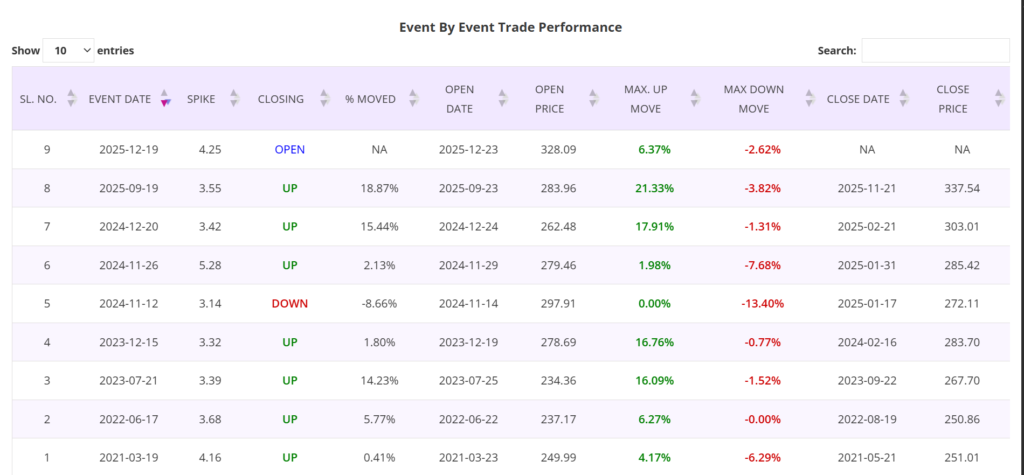
Understanding the detailed report - Event By Event Trade Performance
As the name implies, in this section of the detailed report, you can see how the underlying Stock or ETF moved during the 9 week period beginning the second trading day after the volume spike event for each of those events. As an example, for the volume spike on EVENT DATE of 19 September 2025 which had a SPIKE size of 3.55, the OPEN DATE of the trade being 23 September 2025 at OPEN PRICE of 283.96. Since opening the trade, the Stock moved UP by 21.33% and DOWN by 3.82% and finally closing at CLOSE PRICE of 337.54 which is 18.87% higher than the opening price, on CLOSE DATE of 21 November 2025.
Similar figures and numbers are provided for each of the volume spikes since 1st January of 2021 till date, in this section of the detailed report.
Please note that, whenever you trade a Stock or ETF, it will almost never go straight UP or DOWN, it will hover around the current price or make brief moves in either direction before it will make big bullish or bearish moves.

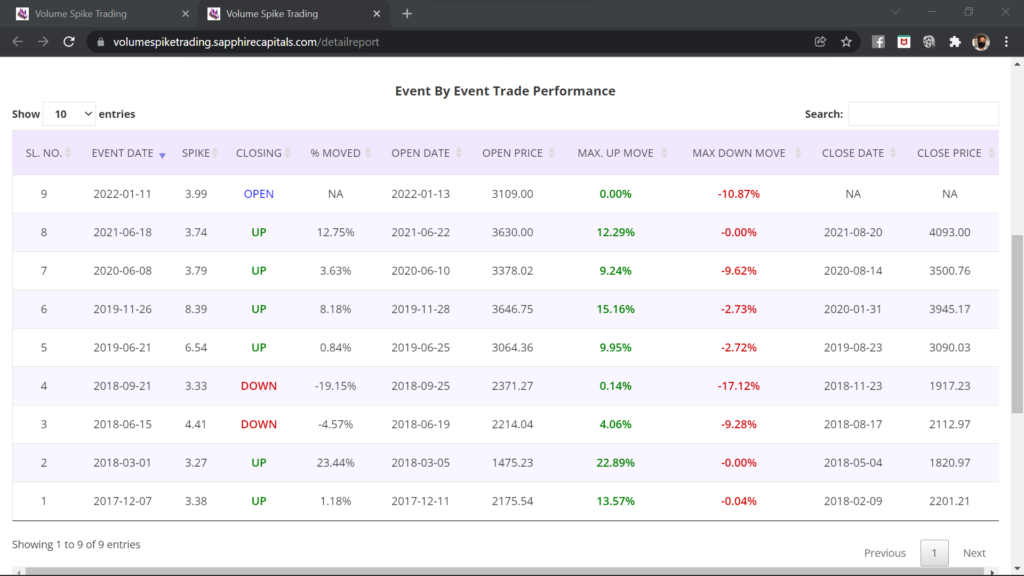
As mentioned earlier, all columns of the Event by Event Trade Performance table are capable being sorted by clicking on the column names. You may sort the columns in any manner you like for your analysis. But at the minimum, you would like to click the EVENT DATE column so that you can sort with the latest events at the top, see the image below. In this example report with sorting of EVENT DATE column, you can see that top row in the CLOSING column are marked as OPEN. This means that the trade opened following the volume spike event after those two days are still open as 9 weeks have not yet elapsed. Accordingly, MAX UP MOVE and MAX DOWN MOVE columns only show the moves as on date of running the app. Also the information for columns CLOSE DATE and CLOSE PRICE are Not Available.
Get visual with charts
In the detailed report page, look at the CHARTS button at the top right hand side of the page as shown in the image below. Clicking on the button opens up charts in a separate tab of your browser.
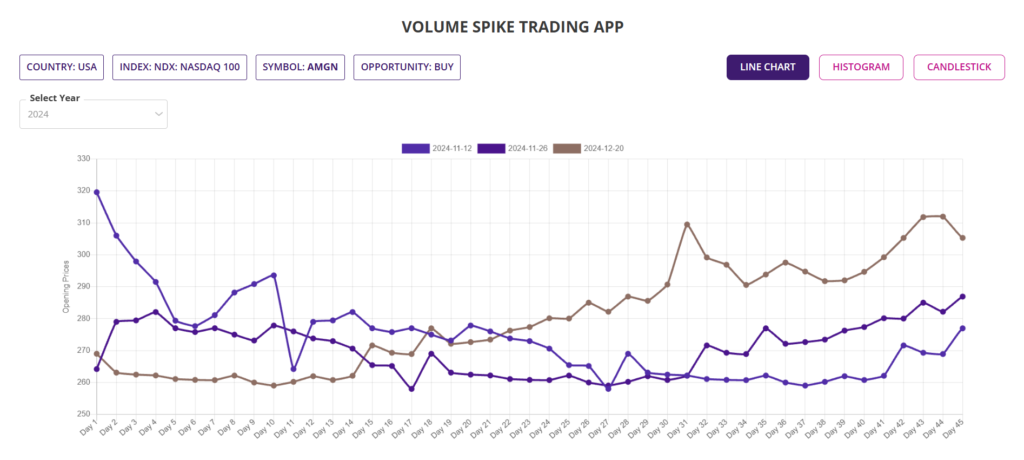
Line chart
The Chart page opens up with the Line chart as shown in the image below. The top of the chart page shows you the critical information of interest to you such as the country, index, symbol and opportunity type, so you know what chart you are looking at.
This interactive line chart shows number of lines showing the underlying’s price movement for each of the volume spikes for an year with closed trades. In this example, the line chart for the year 2024 is shown which had more than one volume spike event for the Stock in that year. If you want to see the line charts pertaining to volume spike events in previous or later years, please use the pull-down menu on the upper left side of the page to select the year.
Each line in the line chart is in different colour and the lines are idenfied by the legend at the top of the chart; if and when there are multiple volume spike events in a year. Click on the legend colur box with the year next to it, to switch that line on of off. You may selectively switch on or off certain lines pertaining to certain events to visually analyse how underlying Stock price moved for some volume spike events in a year compared to others.
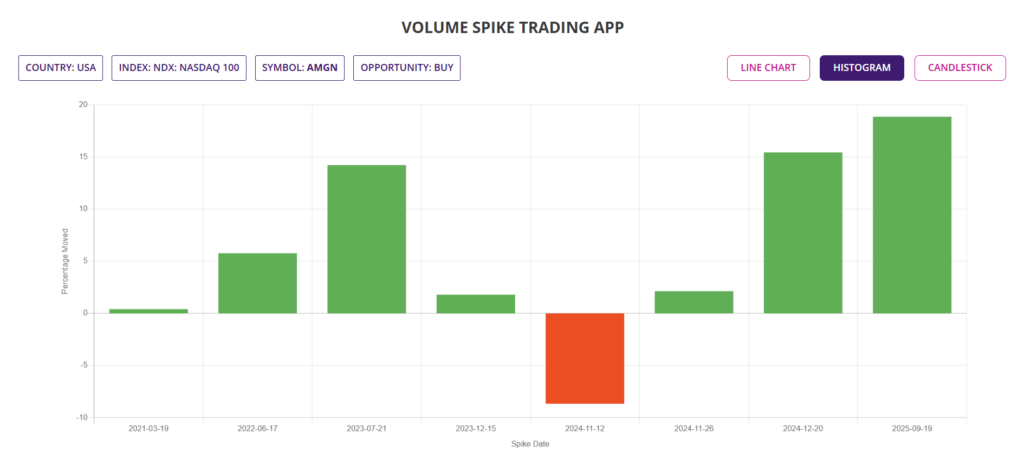
Histogram
The second chart that can give you a very quick visual clue of the size of the bullish or bearish moves, during the nine weeks period following the volume spike, is the Histogram chart. You can get to this chart simply by clicking the HISTOGRAM button on the top right side of the charts page.
The histogram chart is drawn with each bar height proportionate to the percentage move the Stock or ETF had made after each of the volume spike events. The histogram in this example chart for the Stock mentioned has only 8 bars for each of the 8 completed trades following various volume spike events at various times since 1st January 2021. The last volume spike event was followed by a trade which is not CLOSED yet and hence not included in this chart. You may hover the mouse on the histogram bars to know the % move of the Stock for that particular event.
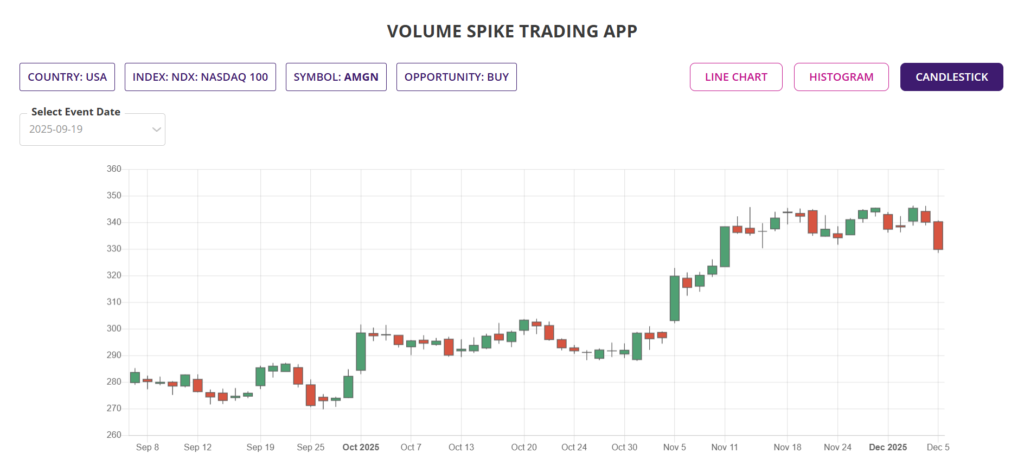
Candlestick chart
By clicking the CANDLESTICK button at the top of the charts page, you can reveal one candlestick chart of the Stock, the first chart to pop up is for the completed trade after the latest volume spike. In this example candlestick chart, it is showing the chart of the Stock following the volume spike of 19 September 2025 as that was the last CLOSED trade after the volume spike on the day.
The candlestic chart is also an interactive chart with a pull-down menu if you want to display the chart for other completed volume spike events. By selecting the date of other completed volume spike events from the pull-down menu on the upper left corner of the page, you can reveal the candlestick chart for those events.
Volume spike trading app - Single Stock/ETF/Index, Premium service
The Single Stock/ETF/Index, Premium service is an optional feature, may not be available to your subscription level. If available to your subscription, it will provide you an alternative method of volume spike analysis for one single Stock or ETF.
The input screen for this option is much simpler as only four different inputs are required for the app to start analysis, all these are marked by numbers 1 to 4 followed by SUBMIT button marked number 5.
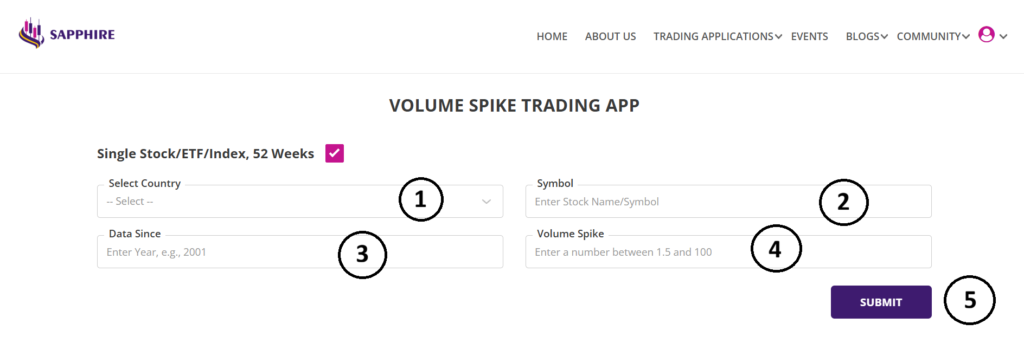
Let’s look at the various input parameters for this option of analysis:
1. Select Country: You can pick the Country as described in the main input section of the app, using the pull-down menu.
2. Symbol: Since this is for analysing single Stock or ETF or Index, you will need to type in the Symbol of the Stock or ETF of your interest. As you start typing the first letter of the symbol, it will auto-suggest the symbols based on your typing input.
3. Data Since: This input has the same meaning as described in the main input section of the app. Please note that, depending upon the Symbol name you provided, the app will automatically pick the year since the Stock or ETF data is available in our Stock database. You may, however, type in another year of your choice; for example type in 2021 for looking into volume spikes for period beginning 1st January 2021 till date or 2022 for period beginning 1st January 2022 and so on.
4. Volume Spike: This is the size of the volume spike you are looking for in the single Stock or ETF of your choice. Type in a number in the box to let the app know what size of spike you are looking for; 3 for 3X spike, 5 for 5X spike and so on.
5. SUBMIT: Click the button when the inputs 1-4 are provided to the app. If any of these inputs are out of range, there will be a pop-up message to let you know of the error.
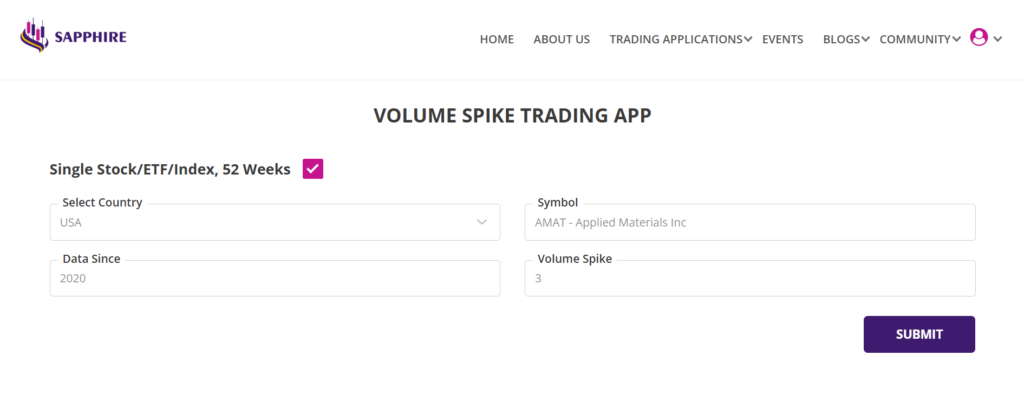
In this example analysis, the inputs used were as shown in the image below.
Summary report - Single Stock/ETF/Index, Premium service option
The summary report for this analysis is as shown in the image below. Please note that, since we are analysing only one Stock or ETF, the summary report has only one line with aggregated details for all the volume spikes for that Stock or ETF. The top of the page is showing the Country and the Opportunity Type of the single Stock or ETF being analysed.
Please note, for the input for single Stock or ETF, you do not stipulate if you are looking for bullish (BUY) or bearish (SELL) opportunities. However, the summary report shows the Opportunity Type as BUY. This is simply because, Volume Spike trading algorithm found more profitable bullish events than bearish events, at least more than 50%.
The summary report in this option is similar to the summary report provided when you analyse using the main input section. In this example summary report for single Stock or ETF, you can see the SYMBOL, NAME, INDUSTRY (if information is available), CURRENT PRICE, VOLUME, SPIKE, OCCURENCES and LAST (last traded price) followed by CONFIDENCE and other information such as ADH, AMU, AMD, RCW, EXP and RRR. All these columns have the same meaning as in the summary report from the main input section described earlier.
Detailed report - Single Stock/ETF/Index, Premium service option
The detailed report for the Stock or ETF can be accessed by clicking the eye icon in the right most column of each row. Clicking the eye icon will open up the detailed report for that Stock or ETF in a seperate browser tab.
The detailed report for Single Stock/ETF/Index, Premium service option also has two sections, upper section with Trade Performance (Single Stock/ETF/Index, non-leveraged) and a lower section described little later.
The upper section with trade performance has same meaning and details as in the detailed report from analysis with the main input screen.
The lower section with Event By Event Trade Performance is as shown in the image below. The columns have the same names and description as in the lower section of the detailed report from analysis using the main input screen.
In this example detailed report for the Stock mentioned, there were 14 volume spikes in the Stock for the period beginning 1st January 2021 till date. All the trades following those events have closed and hence, the detailed report has 14 lines, one each for those 14 volume spikes, and none of those having OPEN in the CLOSING column!
Depending upon the number of volume spikes for the Stock or ETF for the period of analysis, the detailed report can run into several pages with the events listed in chronological order. Please scroll through the pages to understand the report and how the underlying Stock or ETF price played out for bullish and bearish trades.
Charts - Single Stock/ETF/Index, Premium service
Charts for the Stock and ETF analysed by the Single Stock/ETF/Index, Premium service option can be accessed by clicking the CHARTS button on the top right corner on the detailed report as discussed above. You can access the same three different types of charts such as Line chart, Histogram chart and Candlestick chart. The description and details provided by the charts are same as those provided in the detailed report when analysed using the main input.
More information on using the app
If you require more information on using the app, please reach out for support to admin@sapphirecapitals.com. Alternatively, you may send a message or chat to us via WhatsApp by clicking the icon on lower right hand side of your computer or smartphone screen. Additionally, keep an eye on invitations to attend live sessions, held periodically, on this and other app we provide. In these sessions, you can ask questions on using the app, reports, charts or whatever and have your answers in a live interactive session.
FAQ
Our trading app is looking for spikes in daily trading volume by factor of 1.5 to 100, depending on what you ask the app to do. As an example, you could ask the trading app to look for only 2X volume spikes. This means, that app continuously calculates simple average of the trading volume over last 30 days moving window and if on the 31st day, the trading volume was 2X times the 30 days average, the app flags this as a volume spike. Likewise for any size of the volume spike you stipulate in the input filter screens. The app also looks for additional validation the following day after the spike to ascertain if it is a legitimate trading opportunity.
Please note that volume spike is caused mainly by large institutional investors when they decide to move money in and out of a Stock or ETF. Generally, certain Stock or ETF do not stay in their favour for too long. So, it is adviseable to run the app for between 2 to 4 year (“Data Since” input) with a lower confidence so you can see if there is a pattern of how volume spike played out for the Stock or ETF and what’s the trend. As always, its is the Probability which is your best friend in trading.
There is currently no limit on how many times you can run the application. Since, the application is designed to look for price action events on close of trading every day, it is adviseable to run it at least once daily or as many times as you like with your choice of input filter criteria. This will ensure that you will not miss any opportunities when a price action event occurs.
Sometimes, it is possible that the there are no Stocks or ETFs meeting your filter criteria and hence there are no results to display. In most cases, that would be because you are looking for Stocks and ETFs with very high Confidence. Try running the application again with a lower Confidence input and you should get results.
The trading application runs millions of calculations using the parameters you have provided over the selected Stocks and ETFs in the database. We did our best to optimise the codes so as to bring the results faster but we are only limited by what the contemporary technology is able to provide. The time taken to deliver the results is mostly dependant on the size of the index that you are asking to analyse. As mentioned, an index with 500 Stocks will take longer than an index with 100 or 300 Stocks. We will however, continue to work on bringing superior technology for faster delivery of results, as and when we are able to do so.
Once you have made a decision to trade the underlying Stock or ETF that meets your criteria for Probability and RRR (AMD, AMU ratio), you can trade in many different ways depending upon the country you are in and what trading instrument your broker allows such as Stock, CFD or Options.
If you are allowed only to trade Stock, then you can BUY/SELL the Stock or ETF with strict SL/TP (preferably guaranteed SL). If you are allowed to trade CFD, then you can trade similar to trading Stock as just mentioned, except that you will need much lower capital to trade because of leverage available with CFDs. CFD trading is available in Australia and many parts of Europe, but MUST be treated with utmost care because leverage magnifies the wins and losses. Guaranteed Stop should be used as often as possible for protection of your trading capital.
If you are in a country where Option trading is available and your broker allows you to trade, then you could trade in many different ways, some with built-in risk management. Options trading is a vaste subject, we have a training program which you might like to have a look at. Debit spread is one of the Options trading strategies which strictly limits your risk on the downside with very significant RRR. Keep an watch on our blogs for information on strategies like this.
In the trading application, the calculations are based on the Stock or ETF price at the opening of market on the trading day following the day in which the price action event had occured. So, it is recommended that you open the trade as the market opens after the days the price action ecebt has occured. That is the reason, it is recommended that you run the trading application six hours after the close of the day’s market so that you can find if there are opportunities the next day.
After opening the trade with suitable Stop-Loss (SL) and Take-Profit (TP) setting, you would be observing the market to see if either TP or SL is hit. Your TP and SL setting are going to be AMU and AMD respectively for bullish trades and otherway for bearish trades. Because of this being a high probability trade, you would be expecting your TP to be hit within the ADH days. If for some reason, the Stock or the ETF was hovering close to your TP but not quite getting there, it is adviseable to manually close the trade within 9 weeks after the trade was opened.
You may trade volume spike throughout the year as long as there are opportunities meeting your minimum probability criteria and you have RRR of minimum of 2:1, preferably 3:1 or more. On an average, each Stock or ETF will have between 3 to 4 volume spikes per year, both bullish and bearish. So there is no dearth of opportunities, however, you will need to look for those and make sure that those opportunities can deliver the probability and RRR you desire.
Another point you might like to note while using this trading app or any of our other ones, that your trading decision better be aligned with the broad market trend. If it is a BULL market, you would like to have more bullish trades than bearish trades whereas in a BEAR market, you would like to have more bearish trades than bullish trades. Although Stocks and ETFs can often defy the market trends, but it is better to adhere to these for higher probability of your trades playing out as per your assesment.