
Are You Missing Out On The Best Timings To Enter And Exit Intraday Trades? Intraday Seasonality Study Reveals Optimal Timings And Identifies Predictable Cycles For Positive Expectancy And Sustained Profitability
Let Our Intraday Seasonality Day Trading App Find You Positive Expectancy Opportunities By Using Latest Data Science & Computing Technology
Join THOUSANDS Of Traders Around The World
Time-Of-Day Influences Volatility, Liquidity And Expectancy More Than Most Traders Realize
Find Precise Time Window Of The Day For Positive Expectancy Day-Trading Opportunities With The Click Of A Button So You Can Get On With Life!
Day-trading is an adrenaline filled activity for retail and institutional traders alike. Day traders watch multiple charts of multiple Stocks or ETFs, sometimes in multiple timeframes with a range of indicators on those charts to assess the possible move of the underlying Stock and ETF. Keeping a close watch on these charts, making assessment of how the market is setting up for next move and then placing opening and closing trades are what adds to the stress of a Intraday trader. But from the trader’s perspective, it keeps them engaged with the market!
How about if you had prior knowledge about the Stocks or ETFs of historically making large BULLISH or BEARISH moves at certain hours of the day? Wouldn’t it be good to trade ONLY during those hours of the day and leaving the rest of the day for something else that you are passionate about, rather than being stressed from having to continually look at charts?
Sounds great for your day trading? Please read on!
Avoiding statistically weak periods often improves results faster than improving entries
In a trading day, most particularly among the top Stocks and ETFs of the country, there is enormous amount of buying and selling frenzy by institutional investors, retail investors, hedge funds and all. This buying and selling frenzy during the trading hours create a Intraday Seasonality pattern that lives in the market from anywhere between five days to one month.
Although the underlying Stock or ETF might seem to move only by a small percentage in a trading day, it actually moves between the HIGHs and LOWs of the day and in most occasions these HIGHs and LOWs are created in certain hours of the day following a historical pattern.
These Intraday Seasonality patterns occur for a variety of reasons such as institutional investors slowly buying or unloading the Stock or ETF of their portfolio at certain times of the day or after certain news, effect of which lingers over a period of time. Although knowing the reason is not perhaps as important as it is to know that these patterns regularly occur for most of the top Stocks and ETFs in all markets around the world.

For Those Discerning Traders Who Would Like To Have Sound Logic Behind Their Intraday Trading Strategy
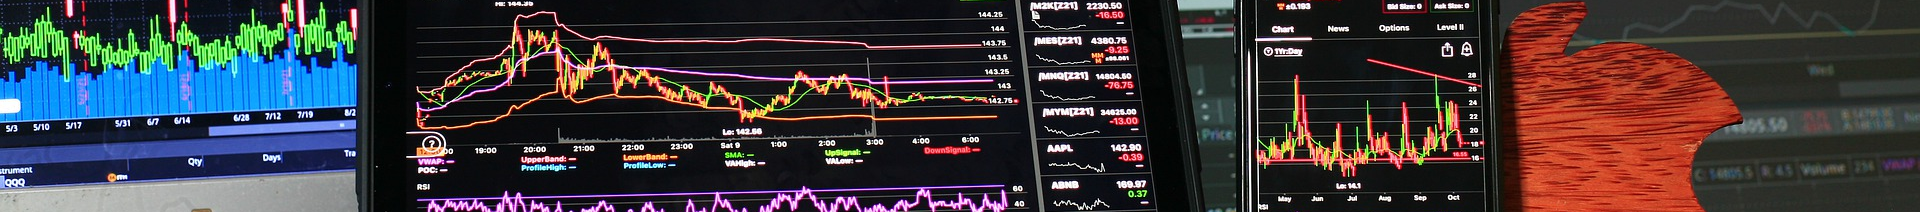
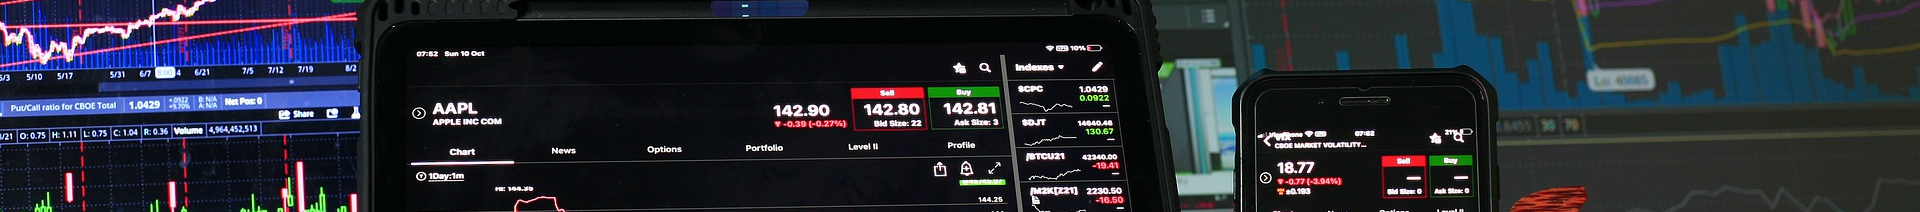
To understand how to identify Intraday Seasonality patterns, have a look at a daily candlestick chart of any Stock or ETF. There is hardly any information that can be used for Intraday trading purposes. Now, if you pick any day or any one candlestick in the same daily chart and break it down to a 1 minute or 5 minute chart, it looks very different! All these information in that 1 minute or 5 minute chart is condensed in one candlestick of the daily chart but provides far more details about the movement of the Stock or ETF during the trading hours of the day. Not only you can see the opening price moving UP to day’s HIGH, moving DOWN to day’s LOW and then closing at a price somewhere in-between but also, the time of the day at which the price moved to these levels.
These HIGH and LOW levels and times of the day when those levels were reached are what you would be looking to exploit to find if there are any recurring patterns. If yes, what does that tell you about Probability of recurrence of these patterns. This is the Intraday Seasonality that will provide a clear block of time when you would like to day-trade the underlying Stock or ETF for positive expectancy.

You Need To Know Why And How Intraday Seasonality Delivers Positive Expectancy!
The Intraday Seasonality trading app looks for matching time-stamped intraday price action patterns for number of days to identify existence of Intraday Seasonality. It looks for consistent move UP or DOWN at various times of the day across the selected number of days with one minute granularity.
The algorithm behind the Intraday Seasonality trading app looks at the top Stock and ETFs and uses these daily movements of the underlying to provide the historical track record of the time of the day at which the underlying Stock/ETF made consistent moves and in which direction. Identifying the patterns and frequency of recurrence provides the Probability you would be looking for, to trade confidently.
Do not take our words for it, please read on and test this for yourself.
Confident Trading Decision Making Requires That You have Detailed Visibility And Understanding Of The Intraday Seasonality Trading Parameters Of Interest
- The app is available to run for some of the most liquid Stocks and ETFs of the world;
- Look for daily seasonality for both LONG (BUY) and SHORT (SELL) opportunities;
- Intraday Seasonality looking back in history for period from 7 to 30 days for consistency;
- Trade with up to 100% Probability of recurrence of these daily seasonality patterns;
- Define trade duration from 60 minutes to 240 minutes;
- Summary and detailed reports provide the top Intraday trading opportunities for the next trading day
* Please read the Critical Subscription Information Summary at the bottom for details
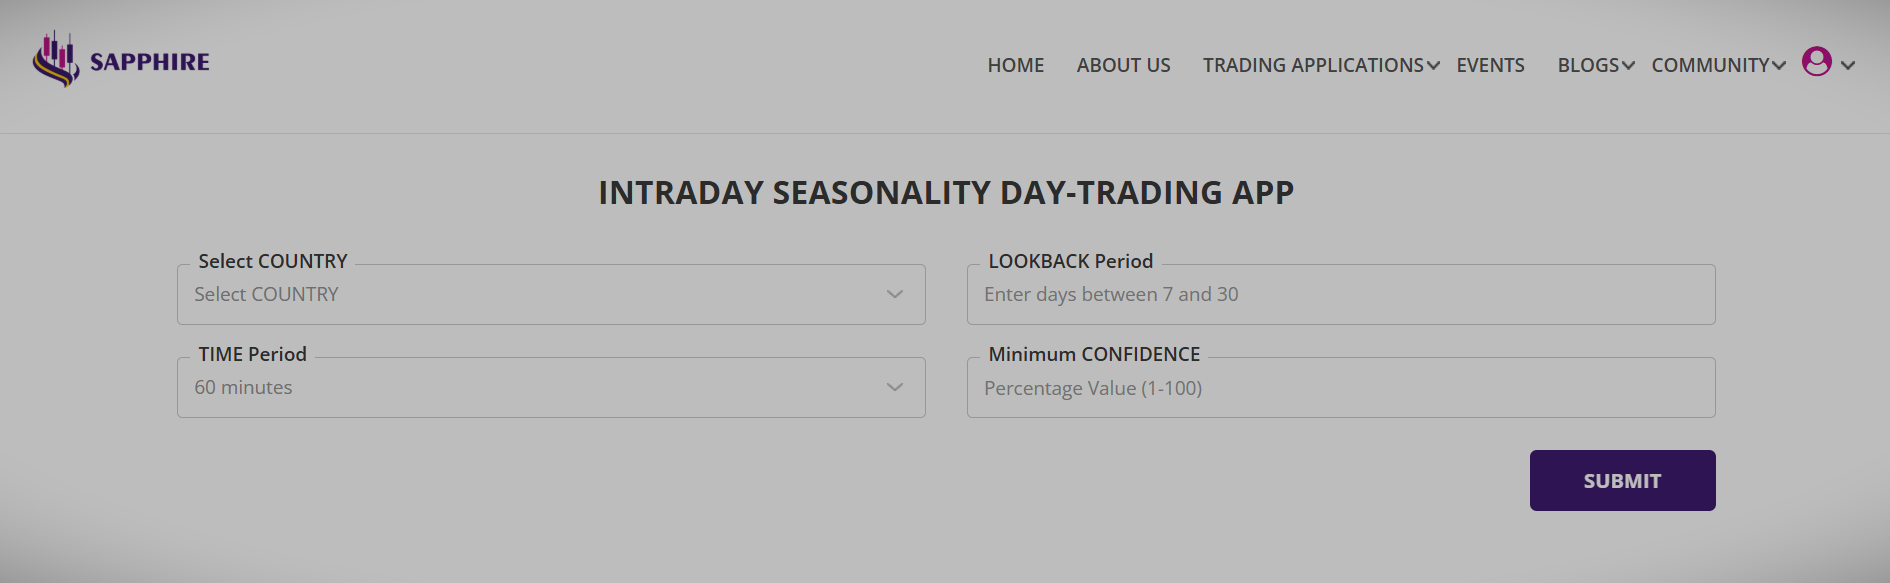
The User Interface Is As Simple As It Can Get So That You Could Find The Opportunities Quickly And Easily
Select the country, type in the lookback period, select time period and finally what minimum confidence of the pattern are you looking for. Lookback period is the number of days over which you are looking for Intraday Seasonality patterns. Time period is minimum size of the time block for which the Intraday Seasonality will be searched.
Confidence is the percentage of the number of successful outcome of the Intraday Seasonality patterns to the total number of days analysed. This is also the Probability of recurrence of the pattern. As an example, a confidence of 90% means that the Stock or ETF price moved in the same direction during the same period in 9 out of last 10 days. So, there is 90% Probability of the pattern occuring again next day.
The Summary And Detailed Reports Have Been Designed with Your Ease Of Use In Mind, We Are Traders Too!
With the user selection of the country and other input parameters, the app begins to look into the stock database for Intraday Seasonality patterns and produces a summary report of all available opportunities.
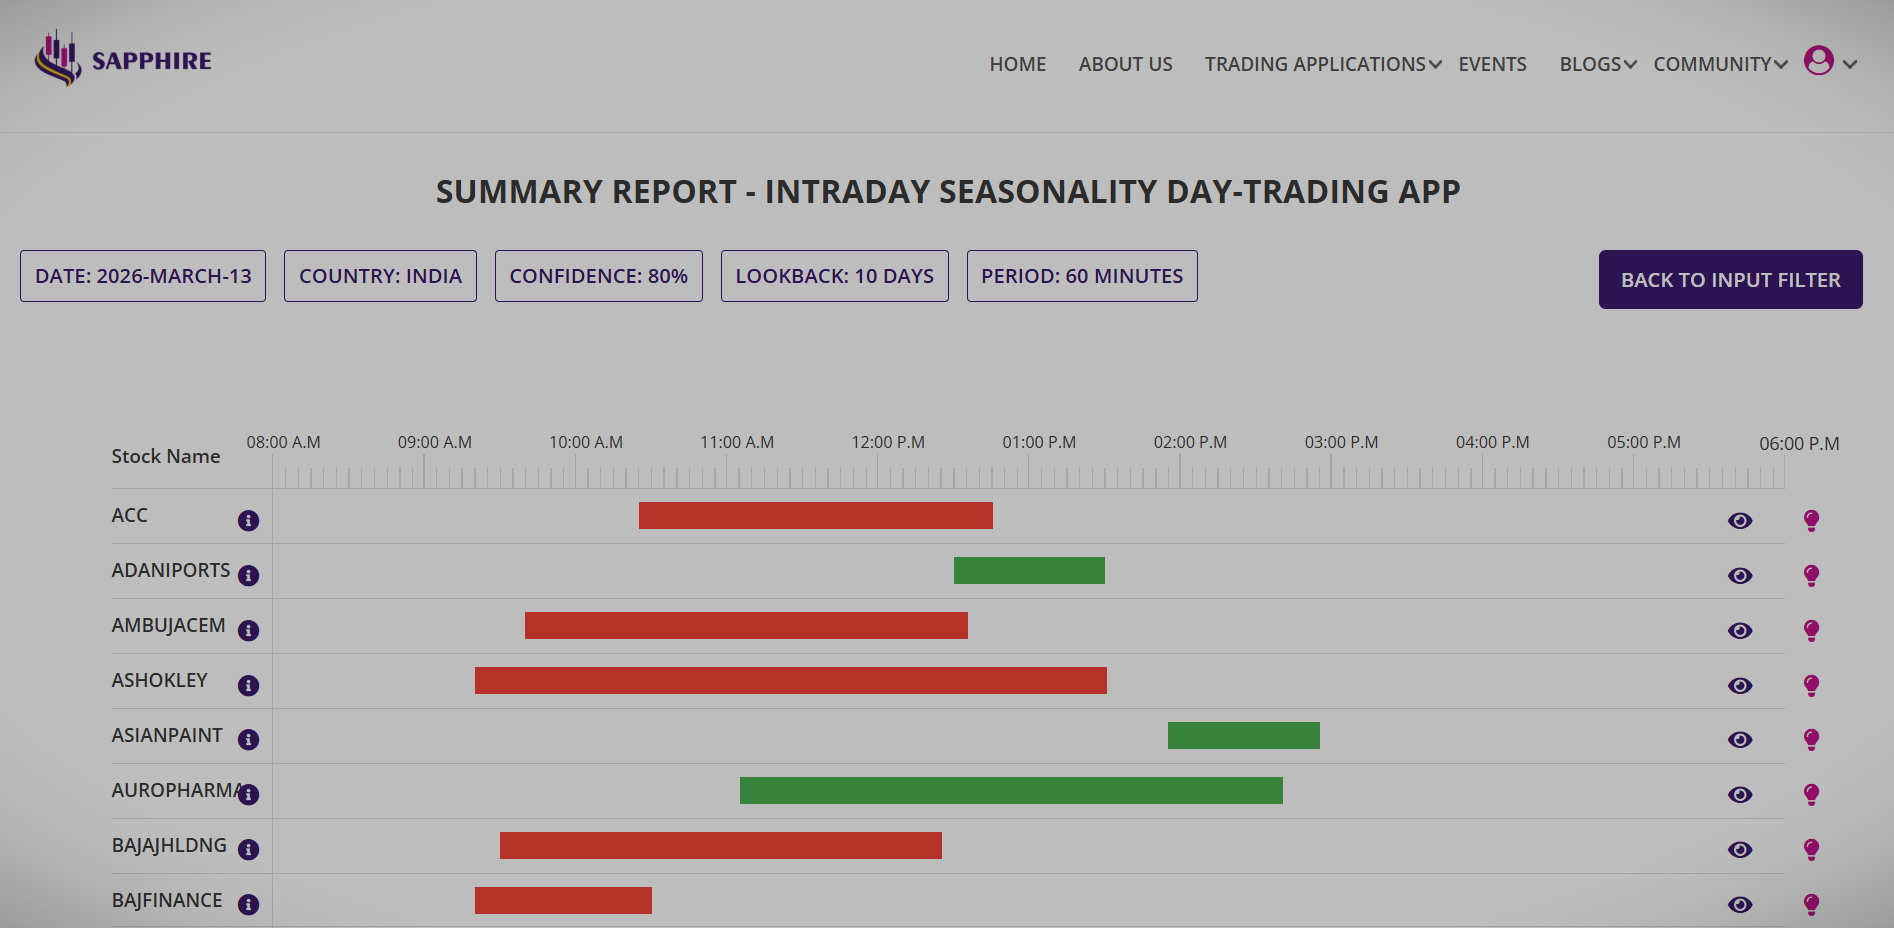
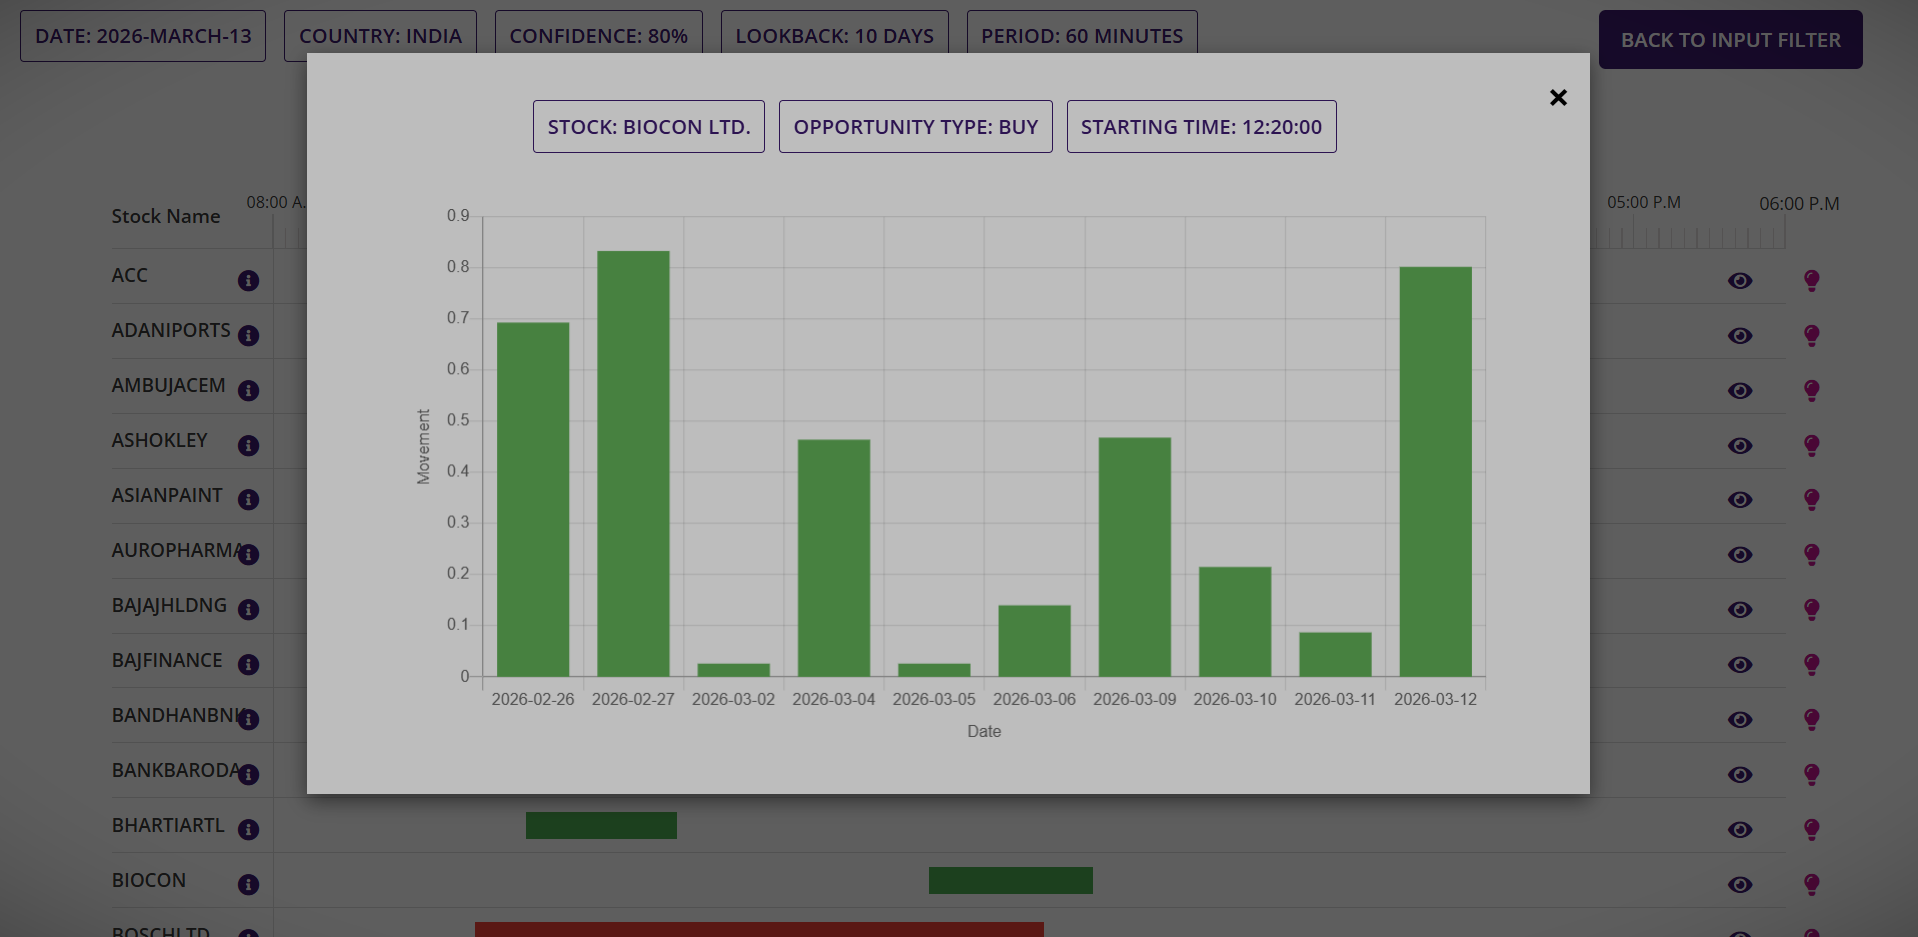
The summary report additionally provides a pop-up histogram showing the underlying Stock or ETF’s daily performance during the period when Intraday Seasonality existed. This is intended to provide a visual of the size of the BULLISH or BEARISH moves of the underlying Stock or ETF during the minimum PERIOD defined in the input filter screen.
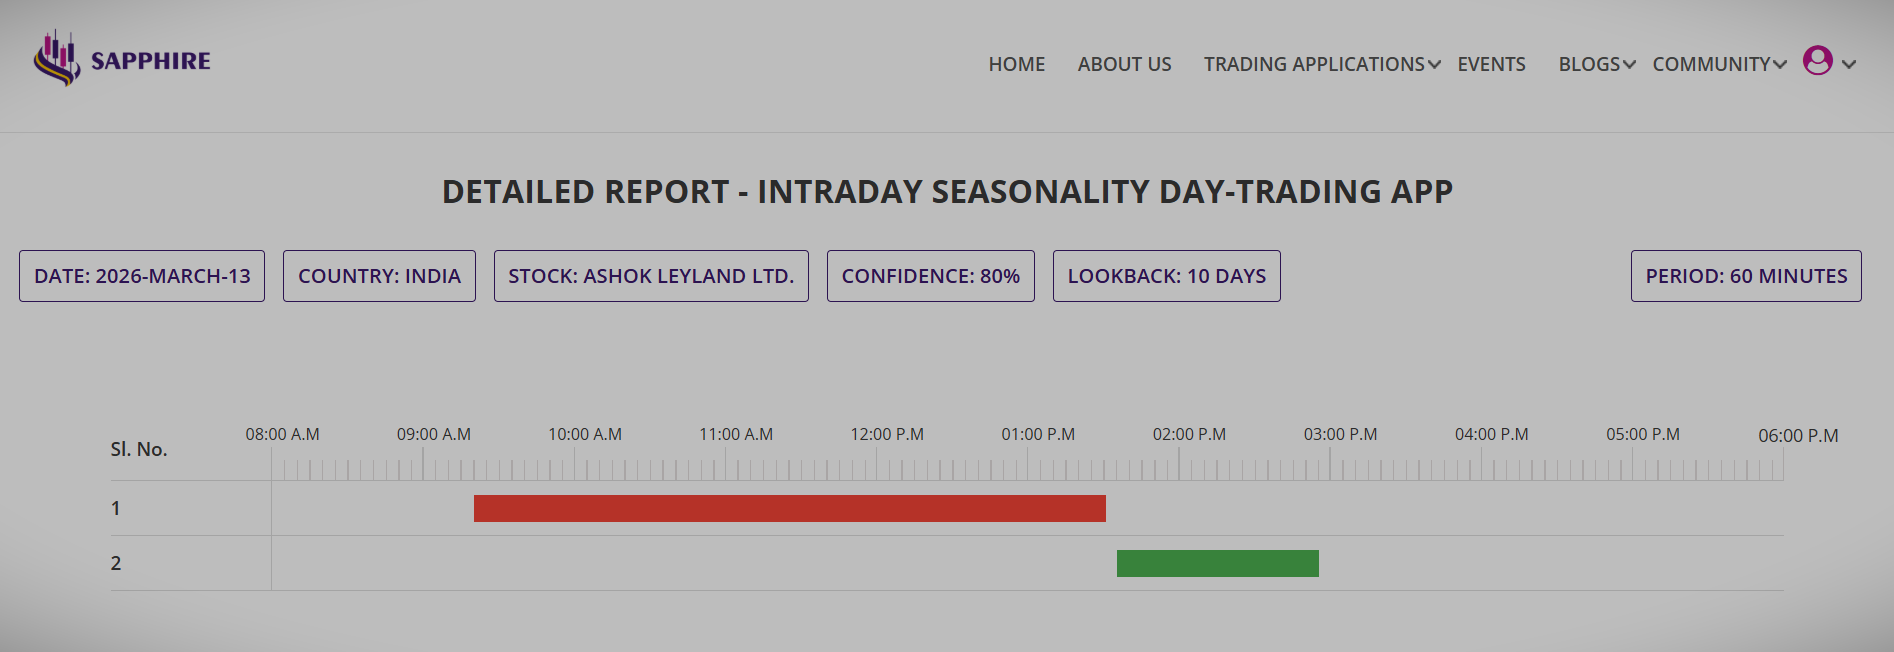
Each of the Stocks or ETFs listed in the summary report can be drilled down for a detailed report. The detailed report provides all other Intraday Seasonality patterns for that particular Stock or ETF, so that you could pick other timeslots for trading, if available.
Trading Intraday Seasonality Is Same As Regular Intraday Trading Except That You Now Know The Time Well Ahead
Now that the Intraday Seasonality trading app is providing the time of the day when the underlying Stock or ETF is going to make the large move, you may trade only during those times of the day. The type of trade that you can place using this information will vary depending upon the country you are in and the broker you are with.
As an example, if you are from a country where derivative trading restrictions apply, then the Stock or ETF could be traded as it is for intraday trading such as BUY to OPEN and then SELL to CLOSE for LONG trades or SELL to OPEN and then BUY to CLOSE for SHORT trades. Please check with your broker if leverage is available for intraday trading and also if any other conditions apply. Leverage should be used with utmost care, make sure you understand the advantage and disadvantages of leverage before you employ it.
If you are trading from a country where CFD and Options trading are allowed, then you could take several types to trades and manage your risk better. As an example, if you would like to trade single Option with the intraday exposure, you could take advantage of LONG ATM Option with 7 to 10 days to expire and profit from BULLISH move of the underlying. Conversely, you could use the SHORT ATM Option for BEARISH move of the underlying. Or you could create a multi-leg Options spread to minimise risk while taking profit from the upside.
In any case, strict money management is the key to successful trading. Keep position sizes small and risk a small fraction of the trading capital so that if the probability does not play out in your favour, your exposure is limited and you could trade another opportunity another day.
Read the tutorial page of the app or visit the video blog section of our corporate website to watch the tutorial on how to use the app or simply request to book an online live session, if you would like to know more about the Intraday Seasonality day trading trading app.
You could also email us at admin@sapphirecapitals.com with any of your queries or send message or chat to us using WhatsApp by clicking the icon at lower right side of your computer or smartphone screen.
Which Country's Stocks And ETFs Do You Support?
Intraday Seasonality trading app is currently available for top 50 to 100 most liquid Stocks from the following countries: Australia, India, UK and USA. The top Stocks mean the Stocks with the top market capitalisation and the highest weightage in the main indexes of the country’s stock exchange.
For USA, the top list also contains the top ETFs by market capitalisation such as SPY, DIA, EEM, GLD and the likes.
FAQs
No, Intraday Seasonality trading app is web-based and designed for you to find the underlying Stocks or ETFs for intraday trading that has high Probability of being BULLISH or BEARISH so that you can trade only during certain pre-defined hours of the day. The most important aspect of using our Intraday seasonality trading app is that you know beforehand which Stock or ETF to trade, when to open and close the trade, what is the Probability of success of your trade and what Reward-Risk Ratio should you expect. It provides “Confidence” as a proxy for Probability, based on various input criteria you provide. Please visit the tutorial page of the app and also watch the tutorial video for better understanding of how the trading app works.
You will need a computer with web browser, internet connection and subscription of the services to access the trading app. It is recommended that you bookmark the URL in your browser for ease of accessing. The trading app has a simple intutive user interface designed for ease of daily use. The only boring part is the time it takes to do some serious number crunching to get your results. We are working on it, to bring you the results faster!
Please note that there is no software download and installation required.
You may run the app as often as you like, there are no set or preferred time. It is recommended that you run the app on all trading days, four hours after the close of trading for the stock exchange of your interest to obtain information about the Stocks and ETFs to trade the next day or you can run the app during the early hours of the day on which you want to trade.
At any instant of time, you may run the trading application for the Stocks or ETFs of one country only. As an example, you pick the country as UK, then you can run the report for all the top Stocks of UK. On completion of the UK report, you may run the application again for the US Stocks and so on.
* Please read the Critical Subscription Information Summary below for details
Critical Subscription Information Summary
After the trial period, your account will be automatically charged for monthly subscription fee. This is a RISK-FREE trial, meaning, if you cancel anytime within 7 days of starting your subscription, you will not be charged. Subscription is month by month, cancel anytime.
A special discount of 50% on subscription fee is currently on offer to new subscribers only. There is no coupon code required, discount will be automatically applied at check-out.
Your Monthly Subscription Fee Is $39
Or equivalent in AUD, EUR, GBP and INR
Your monthly subscription fee covers:
1. Access to the app 24 X 7 and 365 days a year except for scheduled maintenance period or time taken to resolve any technical issues;
2. Access to analysis of top 50 to 100 Stocks from the following countries: Australia, India, UK and USA
3. Additional access to TOP US ETFs such as SPY, DIA, EEM, GLD and the likes;
4. 24 X 7 customer support via email and Whatsapp (24 hours turnarond time) and FREE access to periodic webinars on trading strategy, technology and any other business!
In case you are worried about the value you get and whether or not you are satisfied with that, we thought we would let you know the following:
- The subscription fee can be recovered in one single small trade every month;
- The subscription fee is less than the hourly call out fee of any professional (such as plumber, electrician, handyman etc.) in developed or developing country;
- The subscription fee is also less than the price of a daily cup of tea/coffee for a month; and
- The subscription fee is the minimum to keep our servers, support and services running; remember, we are traders too and managing our own fund is our main business.
If for some reason, it is not for you, cancel anytime, you will not be charged from the following month.
Want To Know More About Our Swing Trading Apps?
Click The Boxes Below And Try These Risk-Free For 7 Days
Disclaimer
Trading in Financial markets has large potential rewards, but also large potential risk. You must be aware of the risks and be willing to accept them in order to trade. Don’t trade with money you can’t afford to lose. This is neither a solicitation nor an offer to Buy/Sell any of the financial instruments mentioned in Sapphire Capital’s training program and the trading apps.
No representation is being made that any account will or is likely to achieve profits or losses similar to those shown. The past performance of any trading system or methodology is not necessarily indicative of future results.
The information provided by the trading app is for educational and research purposes only and are not intended to provide financial advice. Any statements about profits or income, expressed or implied, do not represent a guarantee. You accept full responsibilities for your actions, trades, profit or loss, and agree not to hold the Sapphire Capitals responsible in any and all ways.
Sapphire Capitals is NOT a financial services company as defined by the Australian Securities and Investment Commission (ASIC) or any similar organisation anywhere else in the world as:
- We do not provide financial product advice to our customers;
- We do not deal in a financial product such as buying or selling shares on behalf of a client or issuing interests in a managed investment scheme;
- We do not make a market for a financial product; and also
- We do not operate a registered managed investment scheme.