
Intraday Seasonality Day-Trading App Tutorial
In this page, we will walk you through the details of Intraday Seasonality day-trading app and how to use it for your day trading decisions. This is a fully web-based app running in a cloud VPS server and hence there is nothing to download or install. All you need is the subscription, a computer with web browser and an internet connection. If you do not have subscription for the services, get it here.
Before you run the trading app, it is recommended that you check the status of our servers which host this app and our global Stock, ETF and derivative databases. This is intended to make sure that the trading app is available when you want to use it. We aim to achieve 99.99% availability. You may check the server availability by clicking the link here. Please bookmark this link so that you can have a quick access to the server availability webpage before you access the app.
Important: The Intraday Seasonality Day-trading app is one of the most computation intensive among all other apps we offer. The app performs millions of calculations to bring you the results of analysis and it may take from couple of seconds to several seconds or minutes depending upon the country Stocks and/or ETFs on which the analysis is being run. Some countries will take more than others because of the numbers of Stocks in that country. So, please be patient after you click the Submit button.
Please note: Although we may have used examples using Stocks from one or two countries in this tutorial, but the app is available for most liquid Stocks and ETFs from Australia, India, UK and USA including some of the top ETFs from USA such as SPY, DIA, EEM, GLD and the likes.
Getting started with Intraday Seasonality Day-Trading app
You will first need to log into your Sapphire Capitals account. Once successfully logged in, the app can be launched in one of three different ways:
- From the Intraday Seasonality Day-trading page of the Sapphire Capitals website;
- From your Sapphire Capitals dashboard; and
- By directly going to the app URL.
Each of these three methods of launching the app are described below.
Log in to you Sapphire Capitals account
Go to the Sapphire Capitals portal at www.sapphirecapitals.com and click on LOGIN at the upper right corner of the page to go to the login page. The login page appears like below.
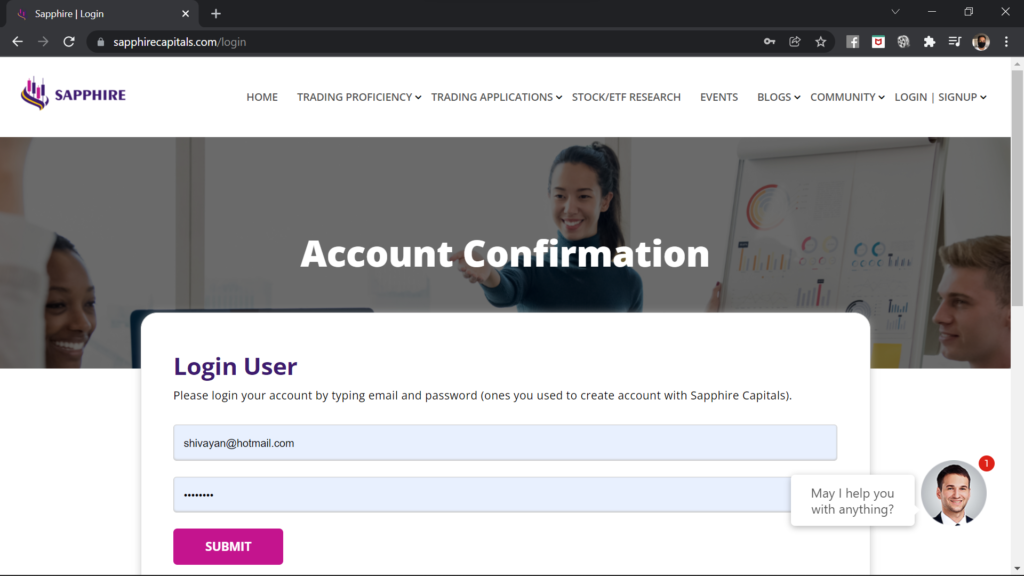
Please login with your email and password, if you already have an account with Sapphire Capitals. If you are a new subscriber, you would have received a temporary password with the welcome email after you had subscribed the service. You can login using your email and temporary password. It is recommended to change the password to a new one that you can easily remember and only known to you.
Once logged in, the Login/Signup menu at the top right corner is changed to an icon as shown in the image below.
First method: Launch from Intraday Seasonality Day-Trading App page
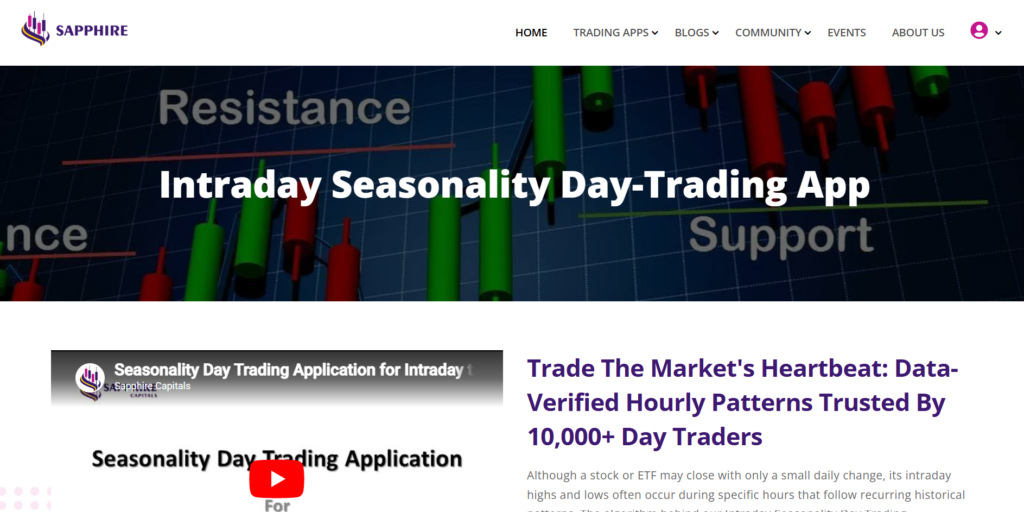
Please go to the top of Sapphire Capitals portal and from the pull-down menu under TRADING APPLICATIONS, select Intraday Seasonality Day-Trading. This will take you to the app’s information page shown below.
Please scroll down to the bottom of the page, which should look like the image below.
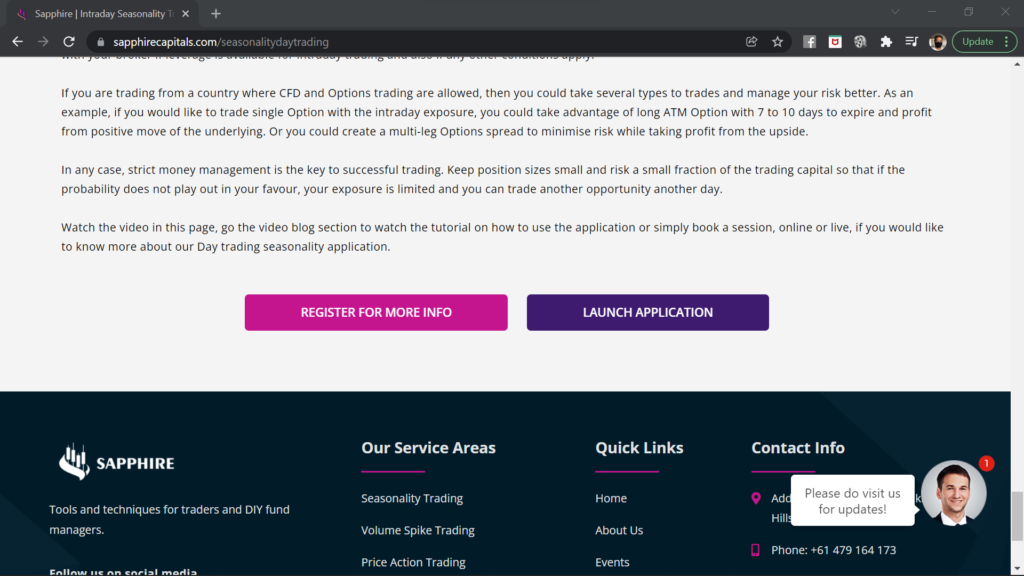
Please click the deep purple button “LAUNCH APPLICATION“. This will open a new tab in your web browser with the app’s input filter page with heading “INTRADAY SEASONALITY DAY-TRADING APP”.
Second method: From your Sapphire Capitals' Dashboard
Once you are logged into your Sapphire Capitals account, you may access your dashboard from the upper right corner of the Sapphire Capitals website. In the upper right corner of the website, when you hover your mouse in your account, it reveals several options including dashboard option. When you click on the dashboard, it will show you a page which looks similar to the image below. If you subscribed to Intraday day-trading app and any of our other swing trading apps, then the dashboard will show you those subscriptions.
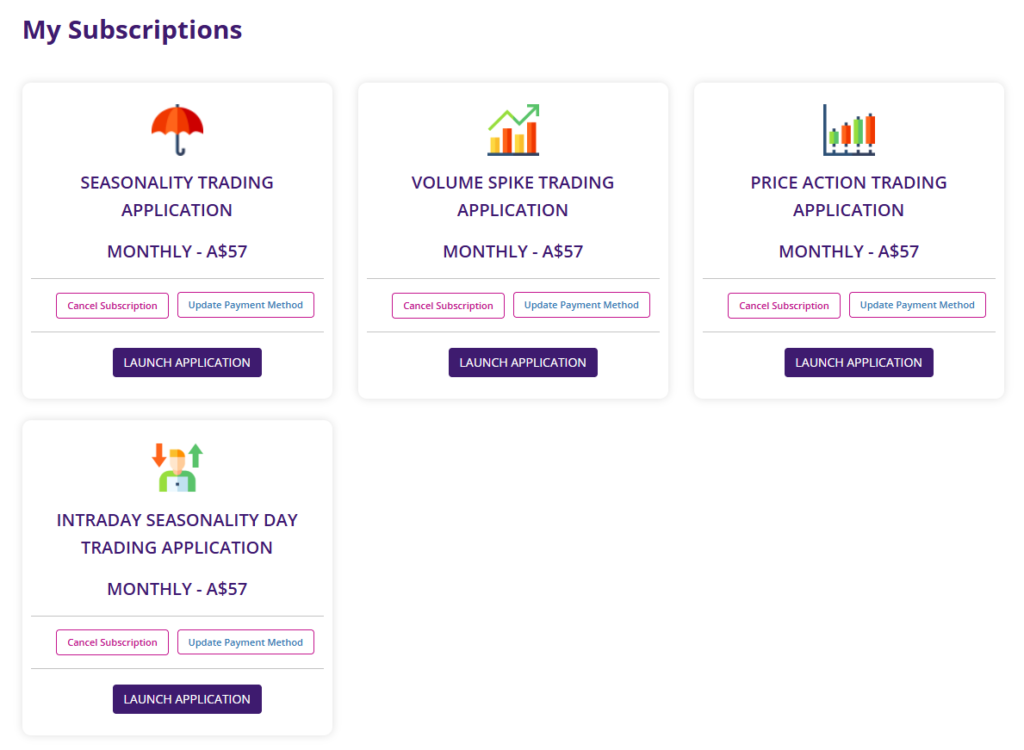
Please click on the LAUNCH APPLICATION button underneath the “Intraday Seasonality Day Trading Application” in all-cap box and it will open up a new tab in your browser with the input filter page of the app.
Third method: by typing the app URL in web browser
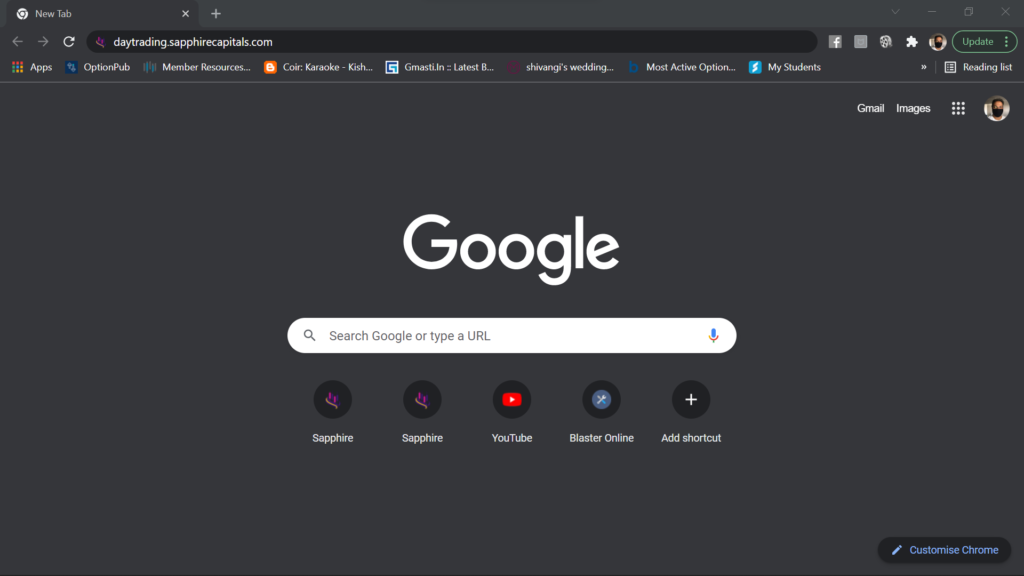
Alternatively, you may open your browser or open a new tab in your web browser and type the following URL: daytrading.sapphirecapitals.com as shown in the image below. If you are already logged in to Sapphire Capitals portal in your computer, it will open the Intraday Seasonality day trading app’s input page.
If you are not logged in, it will ask you to login with your email and password as mentioned earlier. After clicking the SUBMIT button on the login page, it will open the input page of the app.
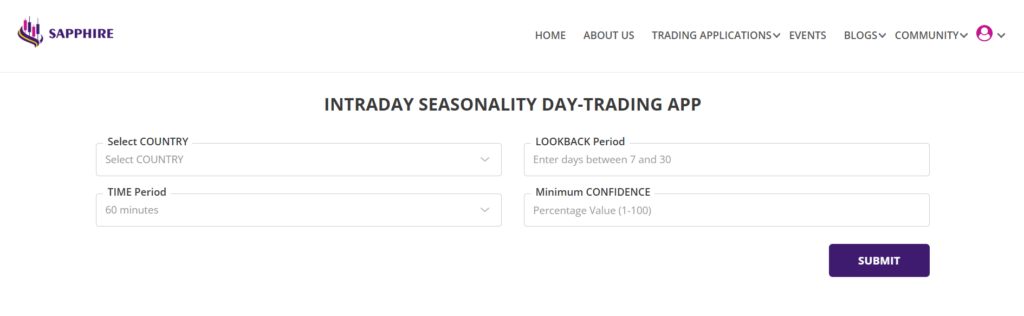
Whichever way you launch the app, you will see the following screen with heading “INTRADAY SEASONALITY DAY-TRADING APP”.
Input to the Intraday Seasonality Day-Trading app
The Intraday Seasonality day trading app input page has four inputs, marked 1 to 4 as shown in the image below, followed by the SUBMIT button at 5.
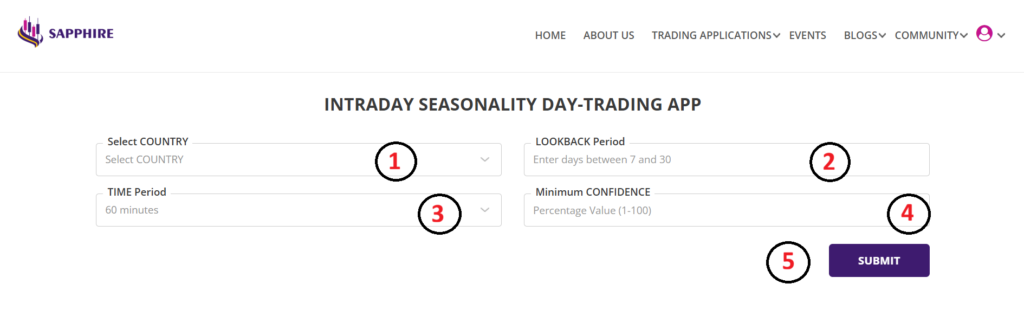
The input filter criteria are as follows:
1. Select COUNTRY: Based on your subscription, you would be offered the selection of the countries from the pull down menu. If you subscribe to multiple countries, then you will be able to select one of those countries from the pull-down menu for running the app, you can run the app only for one country at a time.
2. LOOKBACK Period: This is the number of days over which you would like to look at for existence of intraday seasonality for the Stocks and ETFs of your desired country. The range for this input is 7 to 30 days. Typically your input would be between 7 and 15 days. With this input selection, the app will look for intraday seasonality patterns in the stock price movements for those many days, confirm the existence of patterns and do the rest of the computations.
3. TIME Period: This is the minimum length of time over which the app will look for intraday seasonality. The available options here are 60, 90, 120, 150, 180, 210 and 240 minutes. It is to tell the app that you are looking for trading opportunities that lasted for a minimum length of time you indicated in this field. If you indicated 60, then app will look for intraday seasonality that lasted for at least 60 minutes.
Quick Tip: Look for trades with 60 minutes time period, it will show all available opportunities that lasts over 60 minutes and more, including the ones that would last longer than 60 minutes.
4. Minimum Confidence: This input filter is the minimum probability that you would like to trade with. In the app, Confidence is calculated as the % of times when the intraday seasonality patterns had successful outcome to the number of days analysed, either bullish or bearish. If you are looking for Stocks or ETFs with 90% confidence of intraday seasonality, then the same Stocks or ETFs will have a 90% probability of being bullish or bearish depending upon whether the intraday seasonality was bullish or bearish.
5. SUBMIT button: Click this button after you have provided all the mandatory inputs and any other optional inputs.
Important note: The Intraday Seasonality trading app uses the most complicated algorithm among all the apps we currently offer and involves multi-layer execution of millions of calculations using the inputs you provide at the input filter page. We have implemented the best of software technology to leverage the currently available computational power to bring the results of analysis fast. However, it will take several seconds to several minutes to perform the complete computation and the time is dependant upon the number of Stocks or ETFs in the selected country.
The Intraday Seasonality app is intended for high liquidity Stocks and ETFs for day trading and includes only some of the top Stocks and ETFs of the country. USA has more Stocks and ETFs in the intraday database and will take longer for app to process compared to Australia or UK which have fewer number of Stocks.
Summary report - Intraday Seasonality Day-Trading app
On completion of the analysis, the summary report is presented as shown in the image below.
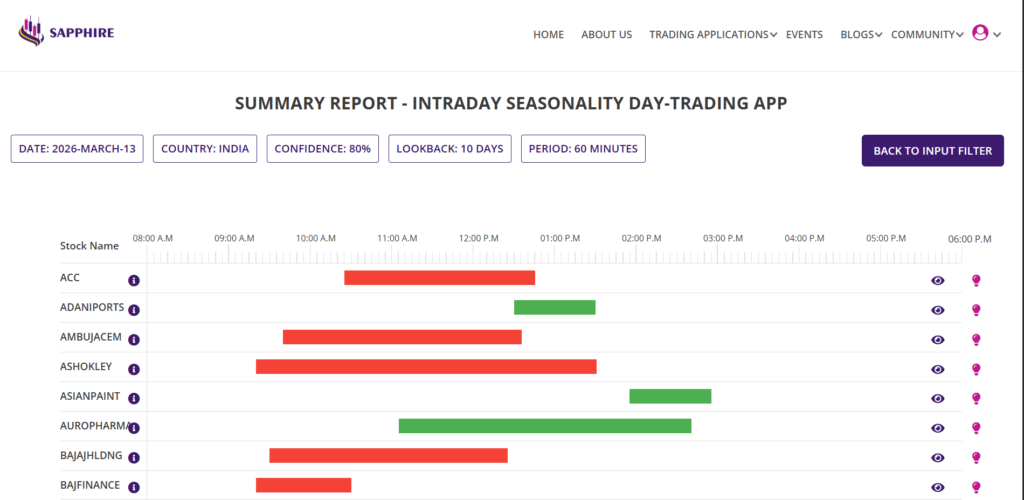
Summary report can run into several pages depending upon your inputs as well as how many Stocks or ETFs were seasonal over the LOOKBACK days based on the input you had provided. Please scroll up and down to review each row of Stocks or ETFs before you pick one or more to trade.
Please note: The report page (both Summary and Detailed report, to be discussed little later) tries to automatically adjust to the screen size of your computer monitor based on your computer’s setting. But sometimes it is possible that report page is larger or smaller than your computer screen and some parts of the report and/or menu may be obsecured from view or look staggered or too small to read. If that happens, please press the “Ctrl” button of your Windows computer and while gently rolling the mouse wheel to adjust the size of the report to fit your computer’s screen size for full visibility. If you are using a Mac computer, try option + command + mouse wheel for same results. If that does not work, you may need additional setting changes in your Mac, check with your computer’s manual.
Understanding the summary report
Let us break it down for you so you know what summary report contains and how to interpret the information provided in various sections of the report.
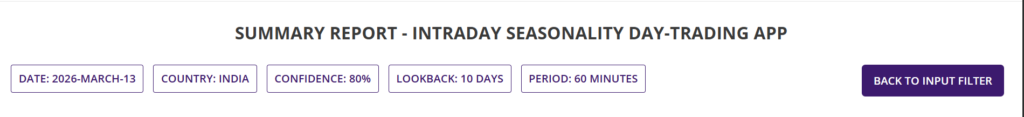
First up, to keep you informed, the top of the summary report shows you what you had privided as input to the app such as the COUNTRY, CONFIDENCE, LOOKBACK and PERIOD. In addition, the it also shows the day on which you had run the app so you know when to use the results for your trading decisions.
The top of the summary report consists of a time line with HOURS of the trading day and the symbols of the Stocks and ETFs that qualify as potential candidate for day trading, as per your inputs, as shown in the image below.
Please continue to read the following few sections to fully understand how to read the timelines so you know how to trade a particular Stock or ETF listed in the summary report.
The time line is a simple horizontal scale, with time of the day or hour of trading of the underlying Stock or ETF. Financial markets around the world start and close at various hours of the day. In some countries the market open at local time of 9:00AM, some at 8:30AM and in some countries it is at 10:00AM. So we have taken a generic approach to use one single time scale to cover trading hours of Stocks and ETFs for most part of the world.
Please note that we only consider the actual trading hours of the relevant Stock or ETF and NOT pre-market or after-hours trading time. This is because, retail traders usually do not have access to the market before open or after close. So, just to be clear, the time line in this trading app is the actual trading hours of the relevant stock exchange in local time.
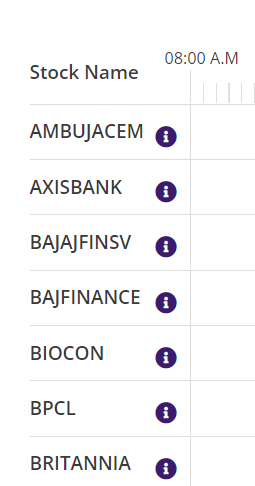
Apart from the trading hours in the summary report, you will see the vertical column with the Stock Name, as shown in the image below. These are the Stocks or ETFs that meet the intraday seasonality criteria you had defined in the input filter page.
Each of the Stock or ETF symbols are followed by an icon “i” in a deep purple circle. Hovering the cursor on the icon will reveal the full name of the Stock or ETF.
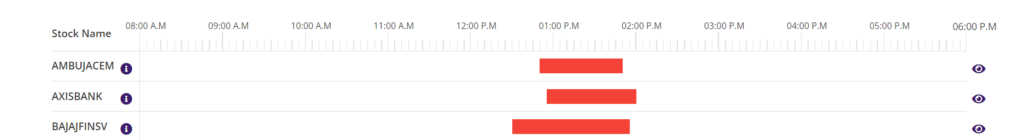
In the summary report, each Stock or ETF on the left is followed by a horizontal bar of either RED or GREEN colour under the time line. Hover the cursor over the horizonal bars to reveal the time period over which the Stock or ETF was seasonal with start time and end time, the minimum probability or confidence in the intraday seasonality (based on criteria input at the filter page) and whether the intraday seasonality was for BULLISH or BEARISH movement.
There are various significance of the colour of the horizontal bar, its position and width of the bar, as described in sections below.
Colour
The colour indicates whether the intraday trading opportunity is for BUY (LONG) or SELL (SHORT). RED bar, in the example image below, means that the Stock or ETF was intraday seasonal where the closing price of the underlying was lower than the opening price. If you had inputted 80% confidence in the input filter, then the closing price was lower than the opening price for at least 80% of the number of days indicated by the LOOKBACK input or 8 out of 10 days or 16 out of 20 days and so on, for example.

Based on the observations above, the Stock is a candidate for intraday SHORT (SELL) trade on 11th February 2022 with a Probability of 80%, as the example app was run on 10th February as indicated at the top of the Summary report.
Similarly, if it was a GREEN bar, then in that case, the closing price was higher than the opening price for at least 80% of the number of days indicated by the LOOKBACK input making it a candidate for a LONG (BUY) intraday trade.
The time and duration of the intraday trade is determined by the position and width of the horizontal bar as explained in the section below.
Position & Width
The starting position of the bar indicates when the intraday seasonality had commenced and the width of the horizontal bar indicates how long this intraday seasonality had lasted for the Stock or ETF based on the input you had provided. In this example, the Indian Stock AMBUJACEM had LOWER prices at 1:50PM compared to the trade opening price at 12:50PM, that’s a PERIOD of 60 minutes as you had selected at the input filter screen. The app will look for Stocks and ETFs of the country where the PERIOD of intraday seasonality was at least 60 minutes. There are two reasons for a minimum PERIOD of 60, 90, 120 minutes etc. is that the underlying Stock or ETF requires that much time to establish a DIRECTIONAL move for your trade to be profitable. And secondly, these periods give you enough time to open and close an intraday trade without having to rush.
So, to summarise what we have discussed so far, if you open a SHORT (SELL) trade on this Stock AMBUJACEM at 12:50 of 11th February 2022 and close the trade at 1:50PM on the same day (it is intraday trade after all), the trade will have 80% probability of success.
Now, the question is how much LOW will the Stock or ETF go during the PERIOD of 60 minutes, in this example trade, for you to profit from the SHORT trade or what is the historical record?
Histogram chart
Now that you know whether the underlying Stock or ETF is a candidate for LONG or SHORT intraday trade and also the time and duration of the trade, but how profitable would that intraday trade be? This question is answered by clicking on the horizontal bar. Clicking the horizontal bar instantly pops up a window with a histogram chart as shown in the image below.
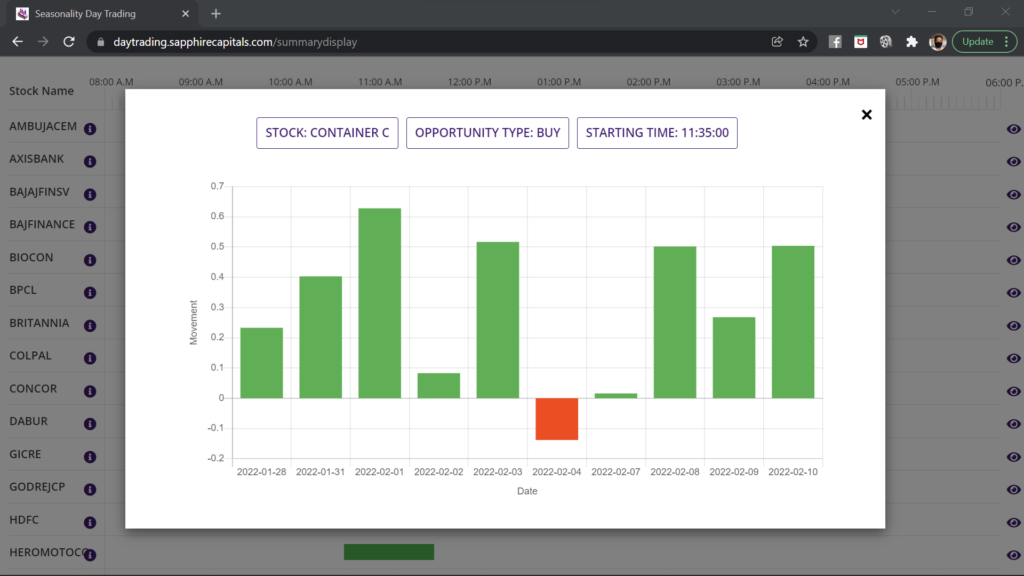
Height of each bar in the histogram chart is equal the size of the move the underlying Stock or ETF had made during the PERIOD (in minutes) in each of the number of days determined by LOOKBACK input. In this example run of the app on 11th February 2022, the histogram is showing 10 bars, one each from 28th January 2022 till 10th February 2022, as shown in the image below.
Since the height of the bars indicate the historical moves of the Stock or ETF over the past days, this gives you an immediate visual indication of how much move could you expect for the intraday trade on the following day. You would be looking for histograms with reasonably steady height of bars across most days, so there is a strong likelihood of the underlying Stock or ETF making similar moves, if not higher, in your intraday trade.
Click anywhere outside the histogram chart to dismiss and go back to Summary or Detailed report from which the histogram came.
Pro Tips!
Remember, Probability and Reward-Risk Ratio (RRR) are your best friends and your best weapon for predictable and consistent profitability while trading Stocks and ETFs. Together they make Positive Expectancy. We have repeated this mantra several times across various pages of our website and communications, a doctorine that you would like to frame and always be mindful of before making your trading decisions.
Tip 1: While you will pick the Stock or ETF for intraday trade, please look for a minimum CONFIDENCE of 80%, preferably 90%, so that you have minimum 80%, preferably 90%, PROBABILITY of success of the trade.
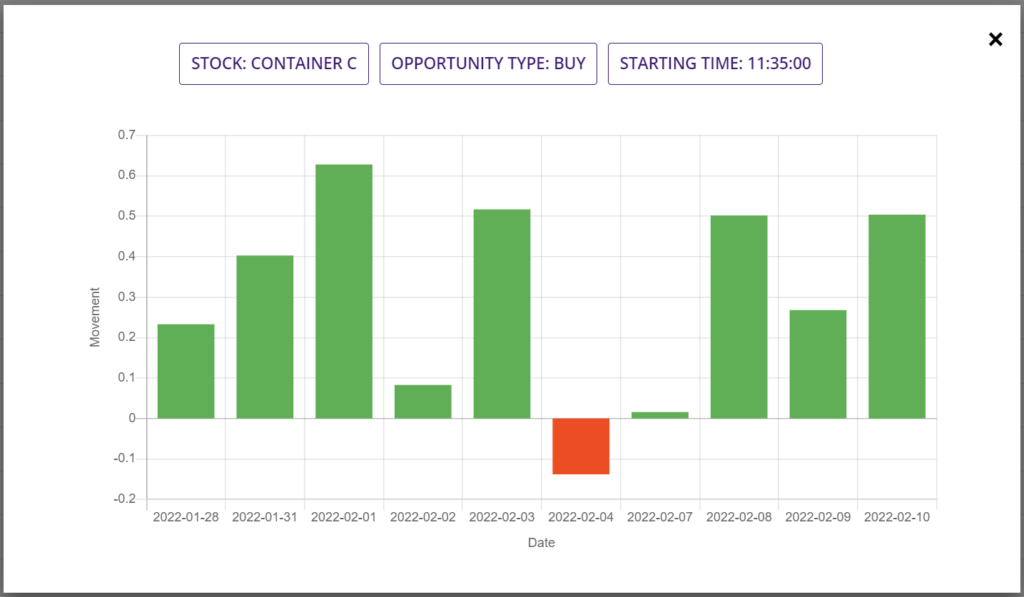
Tip 2: Take a very close look at the histogram chart described earlier in the Summary report section. Two things you can immediately take note of. First, steadier and taller the height of the bars, you will have better chance of having that sized move in your intraday trade. Secondly, the second most important aspect of trading, which is Reward-Risk Ratio (RRR). Look at the histogram example chart above. The intraday LONG opportunity has a probability of 90% as indicated by 9 positive bars and one negative bar, for 10 LOOKBACK days. But look at the only loss day, indicated by RED vertical bar, on 4th February 2022, whose height is about one third of the average of the GREEN vertical bars. This gives you an indication of what you would expect from your intraday trade, a profit potential that is about three times the potential loss or a RRR of 3:1.
Higher the RRR, better it is for your long term trading success. So, please be mindful of visually inspecting the histogram chart while picking the underlying Stock and ETF to trade, always higher than RRR of 2:1.
Detailed report - Intraday Seasonality Day-Trading app
The right most side of the summary report has an eye icon and AI icon, see the image in the Summary report section above.
Click on the eye for a detailed report for the Stock or ETF. The detailed report opens up in a new tab of your browser as shown in the image below.
The definition of Detailed report is slightly different for this app compared to other Swing trading apps such as Seasonality, or Price Action or Volume Spike trading apps. In these three trading apps, the detailed report provides you further details of the opportunity from the Summary report with far greater details on the trade performances with additional charting.
But in case of Intraday Seasonality day trading app, detailed report provides information about any additional intraday trading opportunities for the same underlying Stock or ETF in the Summary report.
Clicking the AI button opens up a new tab in your browser, intended to provide advanced AI analytics covering fundamentals, market sentiments and broker recommendations to compliment the analytics provided by the trading app. This is an upcoming feature, expected to be available shortly, we will keep you updated on its availability.
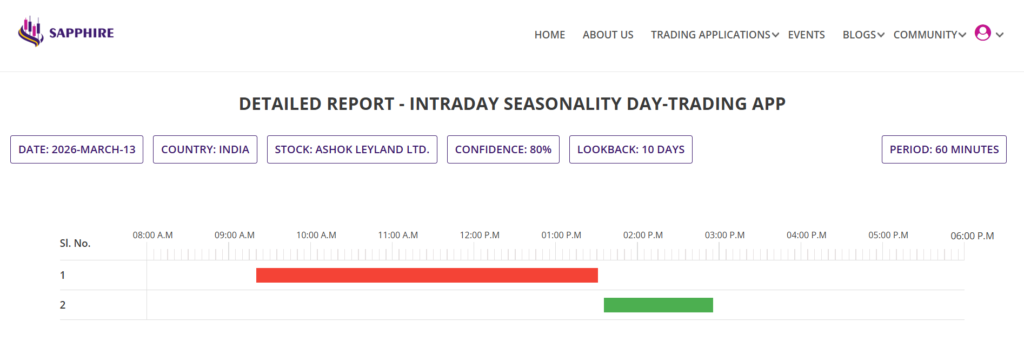
Accordingly, the Detailed report may contain two or more horizontal bars of either RED or GREEN colour as in the image above or just one horizontal bar like shown in the image below. Two horizontal bars in the detailed report means there are two possible intraday trading opportunities for the underlying Stock or ETF and one horizontal bar means there is only one possible intraday trading opportunities exists.
Understanding the detailed report
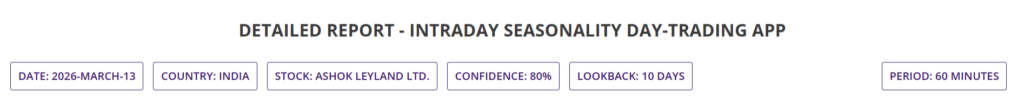
Since you could potentially have multiple detailed reports open for each of the Stocks or ETFs in your Summary reports, the top of the detailed report shows all the information you need to uniquely identify the detailed report that you are looking at. The top section of the detailed report contains the DATE on which you ran the app, so you know the date on which you would be looking to trade that underlying, if you so choose to do so. The other information displayed are, COUNTRY, STOCK name, CONFIDENCE or the Probability you are looking to trade with, LOOKBACK days and finally PERIOD.
The bottom section of the detailed report is as shown in the image below. It is similar to the Summary report with two exceptions.
As mentioned earlier, the detailed report is intended to capture if there are additional intraday trading opportunities for that particular Stock or ETF of interest. You will see one horizontal bar if there were only one intraday seasonality opportunity for that underlying Stock or ETF or two horizontal bars if there were two opportunities and so on. If there were more than one intraday opportunities for the underlying, then the summary report will list only the one which had intraday seasonality for the longest among those. This is to ensure that the best intraday trading opportunities are presented upfront in the Summary report. But you will get to know if there are alternative or more intraday opportunities from the Detailed report.
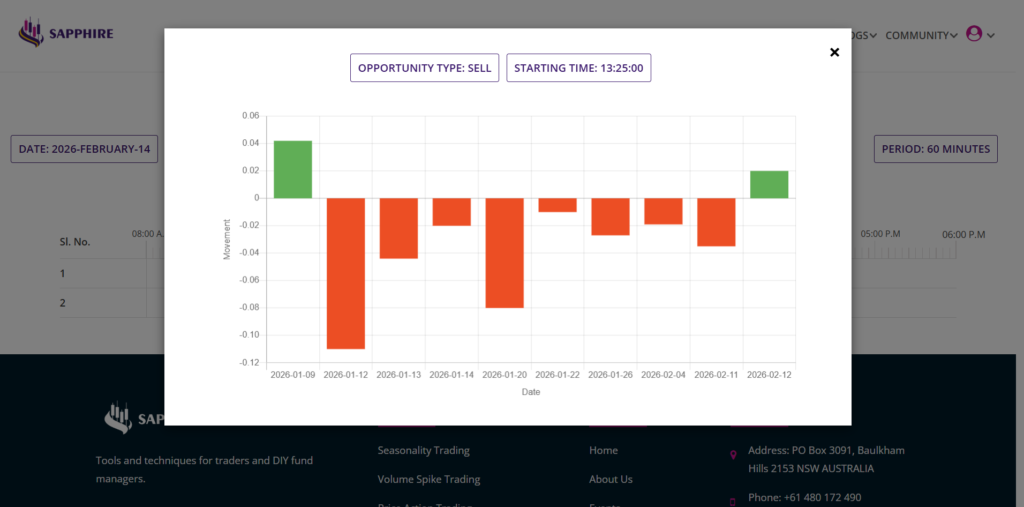
Similar to the Summary report, clicking the horizontal bar on detailed report will pop up a histogram chart, as shown in the image below. The chart will show you the BULLISH (green bar) or BEARISH (red bar) move of the underlying Stock or ETF at the time and during the period shown by the position and width of the bar.
This histogram chart is available for all opportunities in the Detailed report, so that you can get immediate visual clue of which trading opportunity is best for you, in terms of the trading time of the underlying Stock or ETF and also the possible moves for maximum profit.
More information on using the Intraday Seasonality Day-Trading app
If you require more information on using the app, please reach out for support to admin@sapphirecapitals.com. Alternatively, you may send a TXT message or chat to us via WhatsApp by clicking the icon on lower right hand side of your computer or smartphone screen. Additionally, keep an eye on invitations to attend live sessions, held periodically, on this and other apps we provide. In these sessions, you can ask questions on using the app, reports, charts or whatever and have your answers in a live interactive session.
FAQ
Please review the top section of the tutorial on how you could gain access to the app. At the time of signing up, you would have received an email with temporary password and redirected to the login page to gain immediate access to the trading app.
For regular use of the app and ease of use, it is recommended that you bookmark the Intraday Seasonality app page and open the page, as and when you require access. You will be asked to login when you open the page unless you are already logged in from your computer.
Since, the app is for intraday trading, you will be expected to run the app every evening, 4 hours after the close of trade or the morning of the day on which you are looking to place the intraday trade. The intraday Stock or ETF database updates about 4 hours after the close of trade and not real-time, as yet. And hence is the stipulation to run the app 4 hours after the close of trade on the day.
Sometimes, it is possible that the there are no Stocks or ETFs meeting your filter criteria and hence there are no results to display. In most cases, that would be because you are looking for Stocks and ETFs with very tight filter criteria. Try running the app again with little relaxed filter criteria and you should get results.
The trading app runs millions of calculations using the parameters you have provided over the selected Stocks and ETFs in the database. We did our best to optimise the codes so as to bring the results faster but we are only limited by what the contemporary technology is able to provide. The time taken to deliver the results is mostly dependant on the Country you are picking. As an example, USA intraday stock database is larger compared to Australia. So running the app for USA will take longer than for Australia. We will however, continue to work on bringing superior technology for faster delivery of results, as and when we are able to do so.
Once you have made a decision to trade the underlying Stock or ETF that meets your criteria, you can trade in many different ways depending upon the country you are in and what trading instrument your broker allows such as Stock, CFD or Options.
If you are allowed only to trade Stock, then you can BUY/SELL the Stock or ETF with strict SL/TP (preferably guaranteed SL). If you are allowed to trade CFD, then you can trade similar to trading Stock as just mentioned, except that you will need much lower capital to trade because of leverage available with CFDs. CFD trading is available in Australia and many parts of Europe, but MUST be treated with utmost care because leverage magnifies the wins and losses. Guaranteed Stops should be used as often as possible for protection of your trading capital.
If you are in a country where Option trading is available and your broker allows you to trade Options, then you could trade in many different ways, some with built-in risk management. Options trading is a vaste subject, and required education. Debit spread is one of the Options trading strategies which strictly limits your risk on the downside with very significant RRR. Keep an watch on our blogs for information on strategies like this.
After you have made a decision to trade an underlying Stock or ETF based on results from the app, you would have noted the trade opening time from the horizontal bar and also the duration (PERIOD) required. So, it is recommended that you manually open the trade exactly as per the horizontal bar in the Summary or Detailed report. You may also be able to automatically open the trade if your broker platform allows you to do so where you can stipulate the opening time at market price of the underlying.
Closing the trade is also similar, either you can manually close the trade as per the closing time mentioned by the width of the horizontal bar in Summary or Detailed report. Or you could automatically close the trade by time, if so allowed by your broker. Or you could even close the trade after you have reached your profit target using a LIMIT order. Please check with your broker to best implement a strategy that works for you. All manual is also good.