
Are You Missing Out On Predictable Patterns In Stock & ETF Price Movements? Seasonality Analysis Reveals Repeating Opportunities That Swing Traders Trade For Positive Expectancy And Sustained Profitability
Let Our Seasonality App Find You Those Repeating Patterns, Probability And Reward-Risk Ratio (RRR) Using Latest Data Science & Computing Technology
Join THOUSANDS Of Traders Around The World
Research Suggests Seasonality As The Most Consistent Trading Strategy For Positive Expectancy
Know Which Stocks & ETFs Are Set Up For Explosive Moves Every Week With The Click Of A Button!
Imagine knowing every week of the year, which underlying Stocks or ETFs are going make big moves, what high and low levels are these underlyings going to reach, days it is going to take to reach those levels and what are the Probabilities of those moves happening. Study of Seasonality provides not only answers to these questions but also further details so that you can make informed decision before making trading decision.
It is like a calendar or schedule that runs like clockwork that you can take advantage of. Seasonality reveals the repeatable patterns that you are able to exploit by knowing which Stocks or ETFs are set up to make large moves.

See What Study Of Seasonality Can Reveal, Here Are Few Examples
- Australia: AMP Limited (ASX: AMP) goes UP by an average of 5.4% over the same 20 trading days more than 90% of the time for the past 20 years;
- India: Tata Motors Limited (NSE: TATAMOTORS) goes UP by an average of over 17% over the same 43 trading days 90% of the time for the past 10 years;
- UK: Glaxo Smith Kline Plc (LSE: GSK) goes UP by an average of 7.8% over the same 34 trading days 85% of the time for past 20 years;
- USA: Cisco Systems stock (NYSE: CSCO) goes UP by an average of 7.7% over the same 10 trading days more than 80% of the time for the past 15 years;
and there are similar examples from around the world for all kind of underlyings like Stock, ETF, Funds and commodities.
So when you pick one of these trading opportunities, you have a very high Probability that the pattern will be repeated based on the historical evidence of recurring patterns. That is the basis of positive expectancy.

Why You Must Trade Seasonality For Positive Expectancy?
Most businesses are heavily seasonal and their Stock price movements follow this seasonal behaviour creating a recurring pattern that is predictable. The key here is recurring nature of the pattern that provides a sustainable Probability of performing in a manner consistent with previous results.
There have been plenty of research in Universities and Financial markets around the world on Financial market Seasonality. One such research, including a study encompassing 200+ years and 68 markets, underscores that an investment strategy based on seasonal trends beats all other strategies. In fact, it actually leaves far more popular strategies far behind in all key metrics.
If you are interested to read those research papers, drop us an email at info@sapphirecapitals.com.

Our Seasonality Trading App Employs A Proprietary Algorithm to Identify Seasonality Patterns Of Stocks & ETFs
- Look back in history for ten, twenty or thirty years of Stock and ETF data
- Find opportunities for your desired level of Probability
- Find out historical HIGHs and LOWs of the Stock for each year
- Find out the time taken for the Stock to reach those HIGHs and LOWs
- Both trading opportunities covered: LONG (BUY) & SHORT (SELL)
- Pick by all the Stocks in the Index or single Stock or ETF for analysis
- Summary report providing all available opportunities
- Detailed report providing results for each year of analysis
- Complete trade performance for the number of years analysed
- Includes total profit, maximum consecutive wins and such key parameters
- Three charting function built-in for better visibility
- Candlestick and histogram for better insight of historical results
* Please read the Critical Subscription Information Summary at the bottom for details

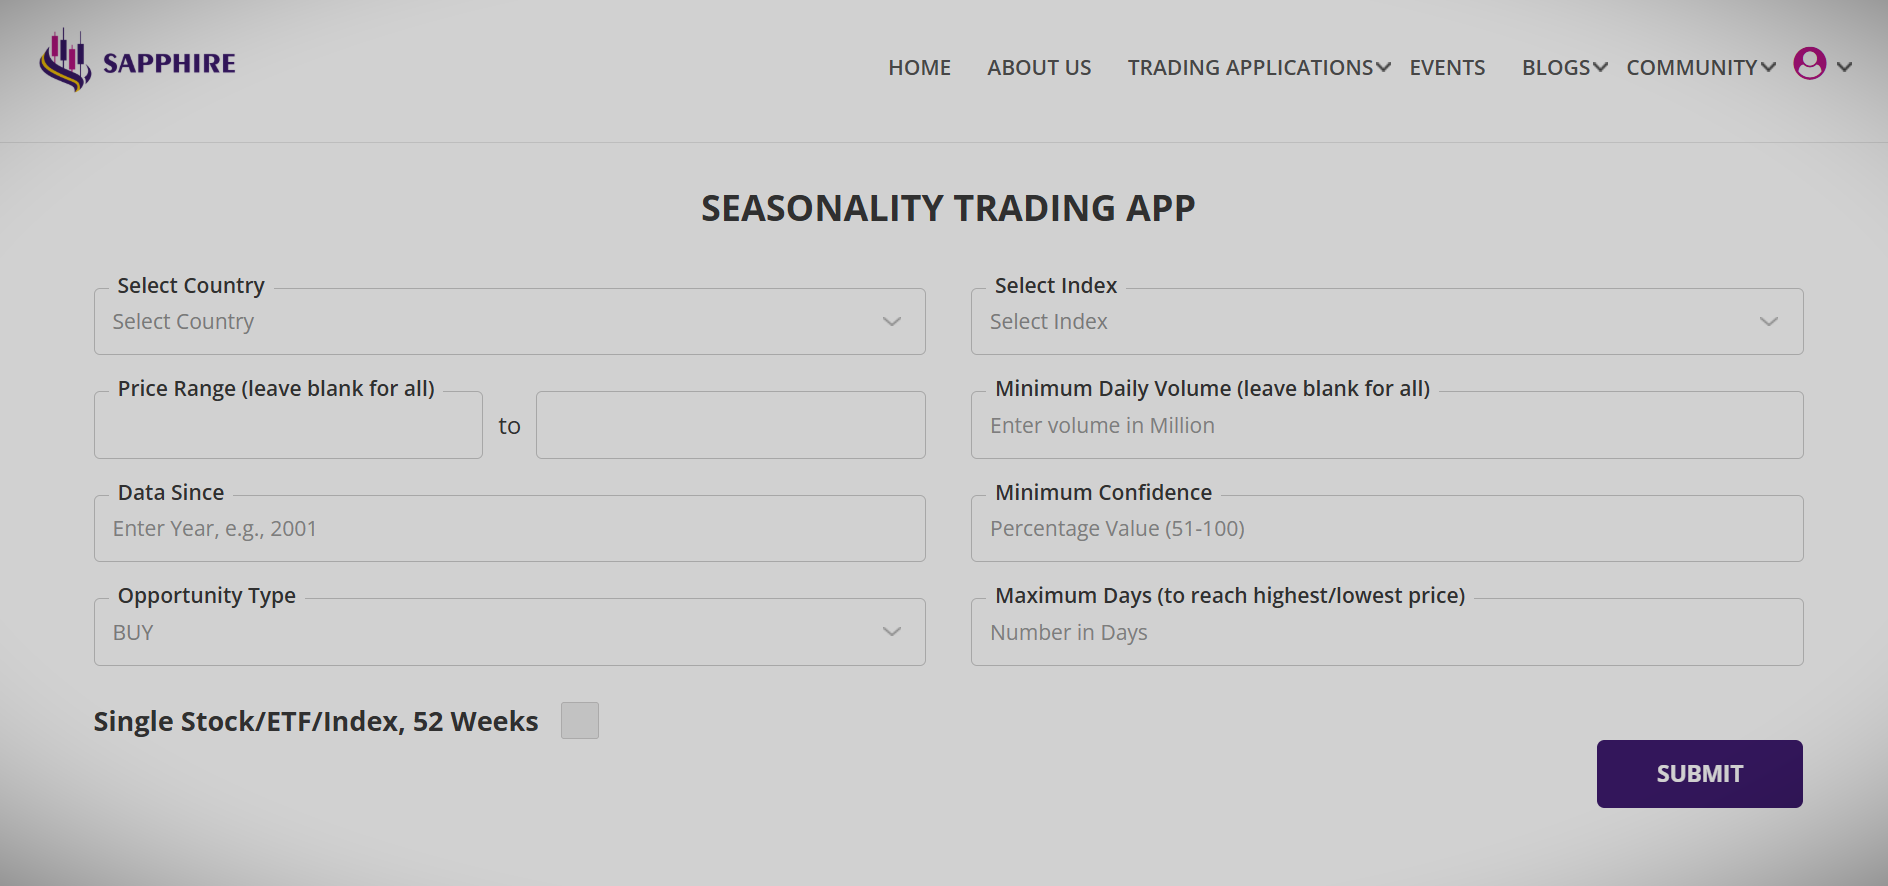
Swing Trading Stocks: We Have Designed The User Interface For Simplicity And Ease Of Use So That You Can Stay Focussed On Trading
Select the country, select the index you are interested in, select whether you are looking for (BUY) LONG or (SELL) SHORT opportunities, type in which year since you would like to look at for the seasonality pattern and finally what minimum confidence of the pattern are you looking for.
Confidence is the percentage of the number of successful outcome of the patterns to the total number of patterns during the years of analysis. This is also the Probability of the recurrence of the pattern. As an example a confidence of 90% means that Seasonality pattern with desired outcome (such as the Stock moving UP or DOWN) existed in 9 out or last 10 years or 18 out of 20 years of analysis. So, there is 90% Probability of the pattern recurring again next time.
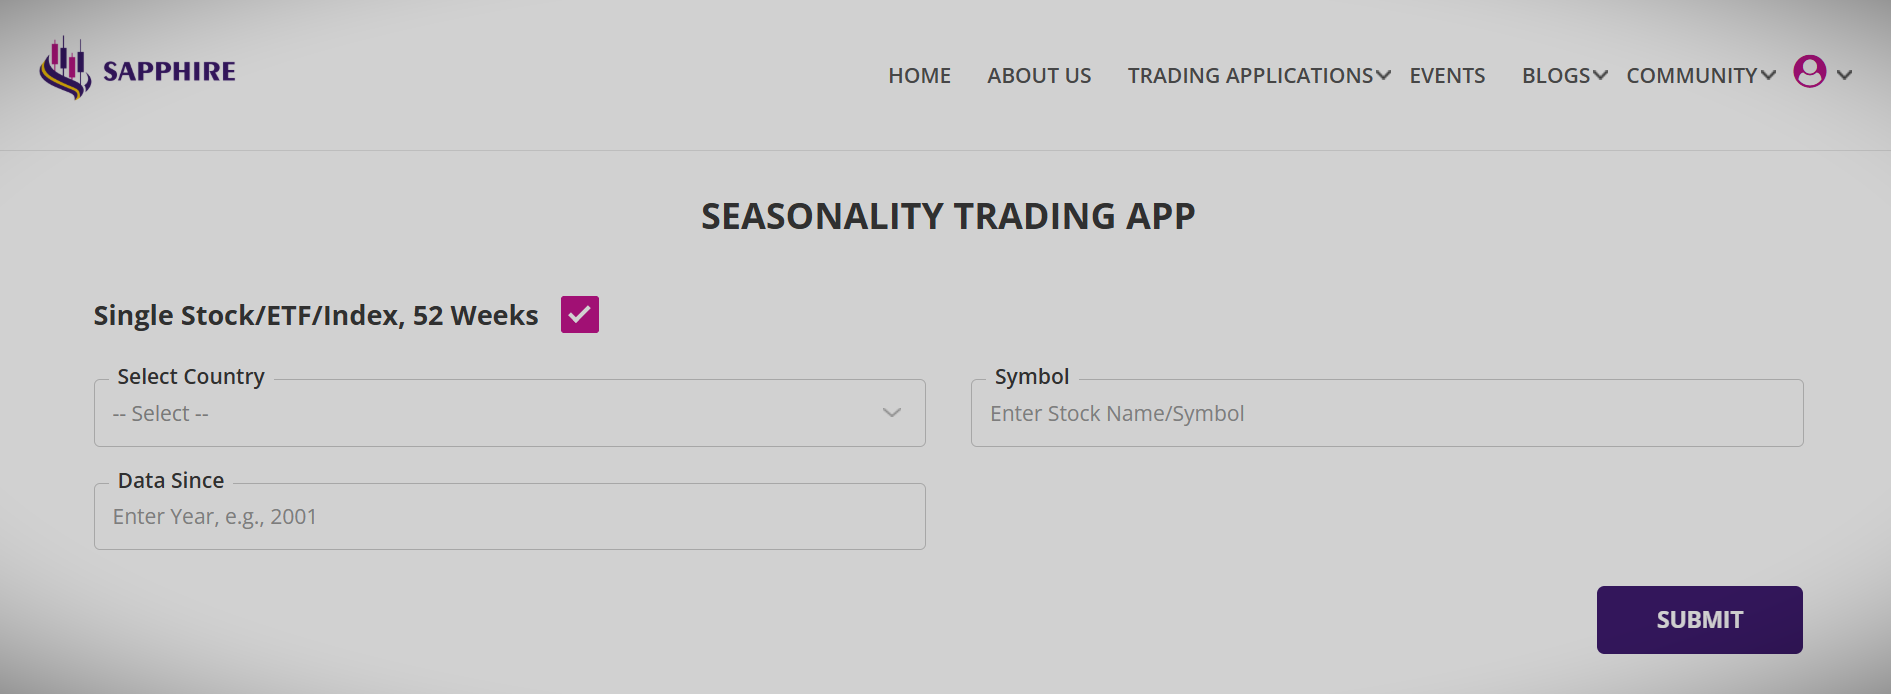
You could also look for the Seasonality patterns in Single Stock or ETF via the alternative 52 Weeks analysis input screen.
The Summary And Detailed Reports Have Been Designed With You In Mind
For better insight into the quality of Seasonality pattern, the Summary report lists four weeks worth of details for each Stock or ETF, beginning the following week after the app is run. The Stocks or ETFs are listed alphabetically with all critical parameters of interest such as volume traded, average move up and average move down, average time taken to reach the HIGH and LOW during the nine weeks period. In addition, there are two proprietary parameters providing even better insight of the quality of these Stock or ETF’s Seasonality features.
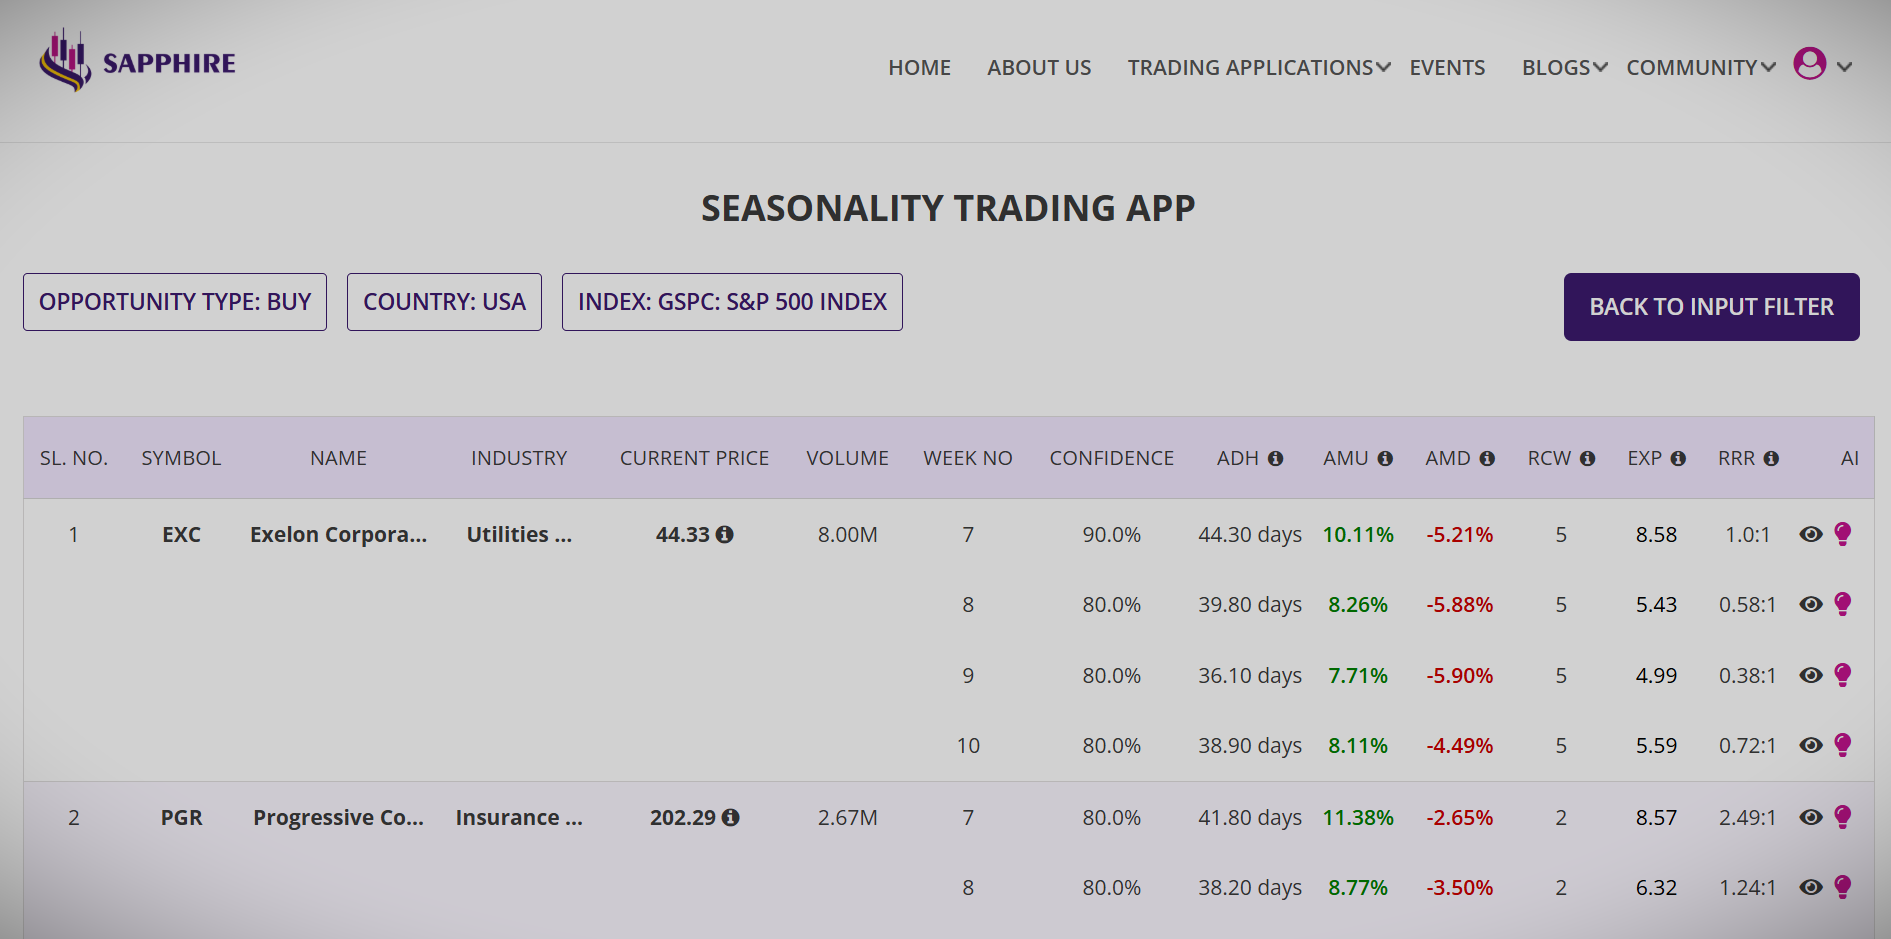
Each of the summary report lines can be drilled down for a detailed report for that week. The detailed report provides you the insight for the Stock or ETF of interest for each week of the Stock or ETF in the summary report, providing detailed insight of trades in each of the previous years.
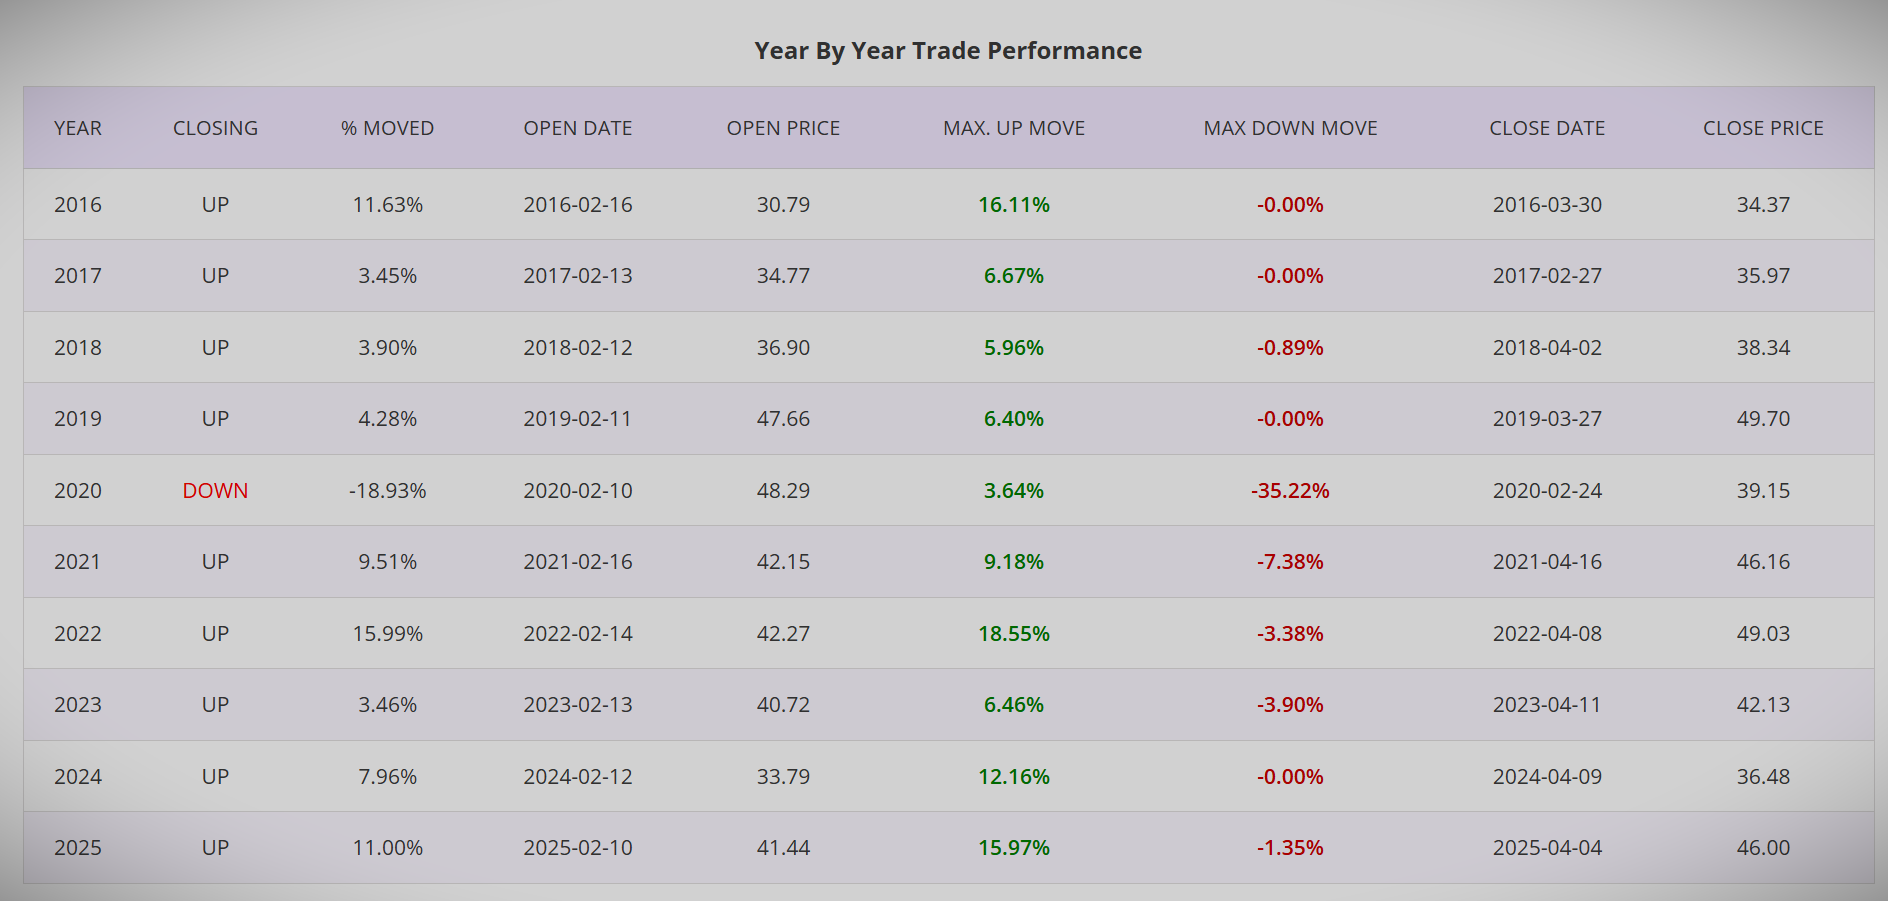
The detailed report has two tables, the one at the top of the report is the trade performance table which summarizes the trading results if one single unit of the Stock or ETF was traded for the number of years for which the analysis was run.
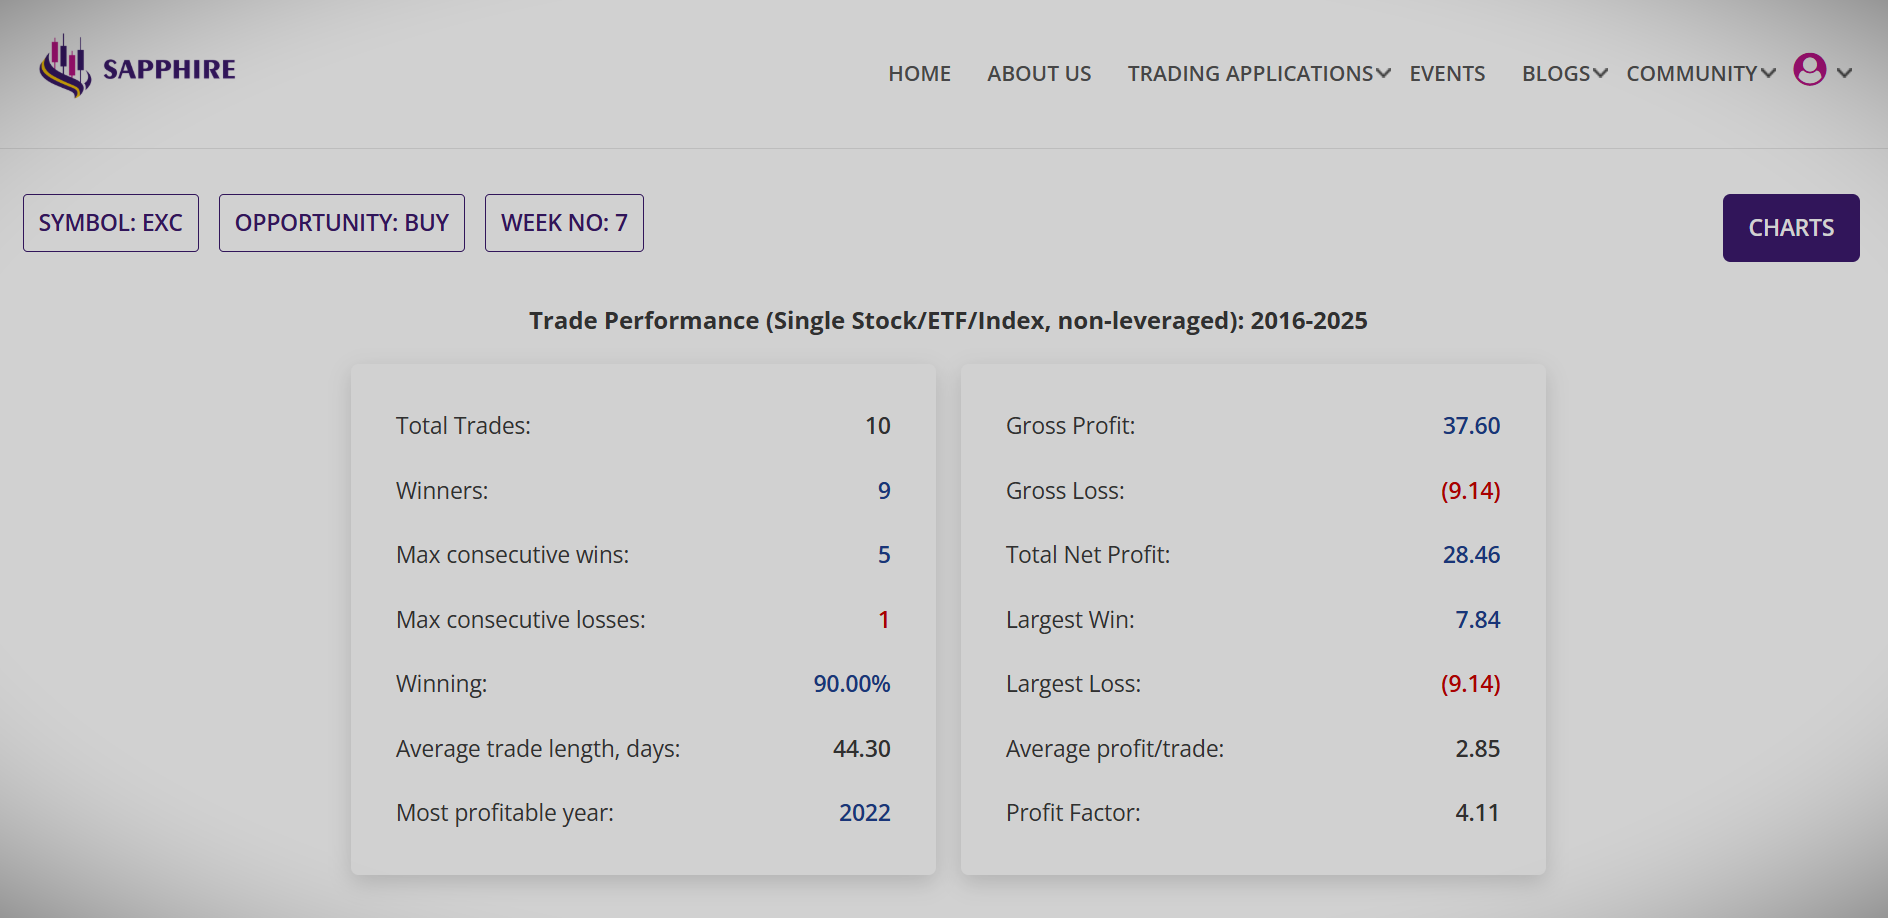
The Year by Year Trade Performance report provides details of the trade in each of the year since, the maximum move up, maximum move down, price at closing of trade nine weeks after it was opened etc.
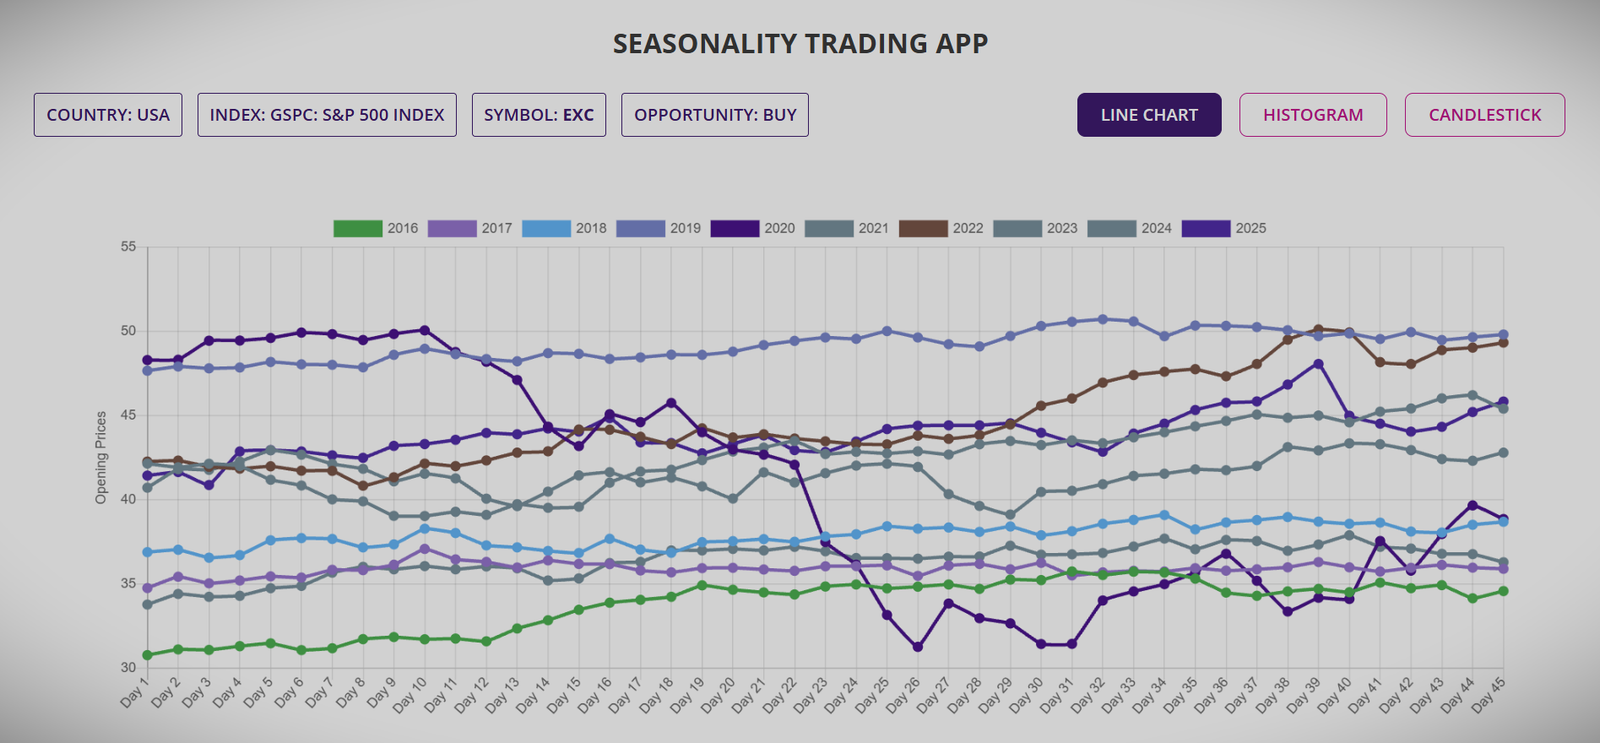
Further insights into the Seasonality pattern are available from a range of interactive charting options.
The interactive line chart provides a glimpse of how the price moved over the observation period for all the years for the chosen Stock or ETF.
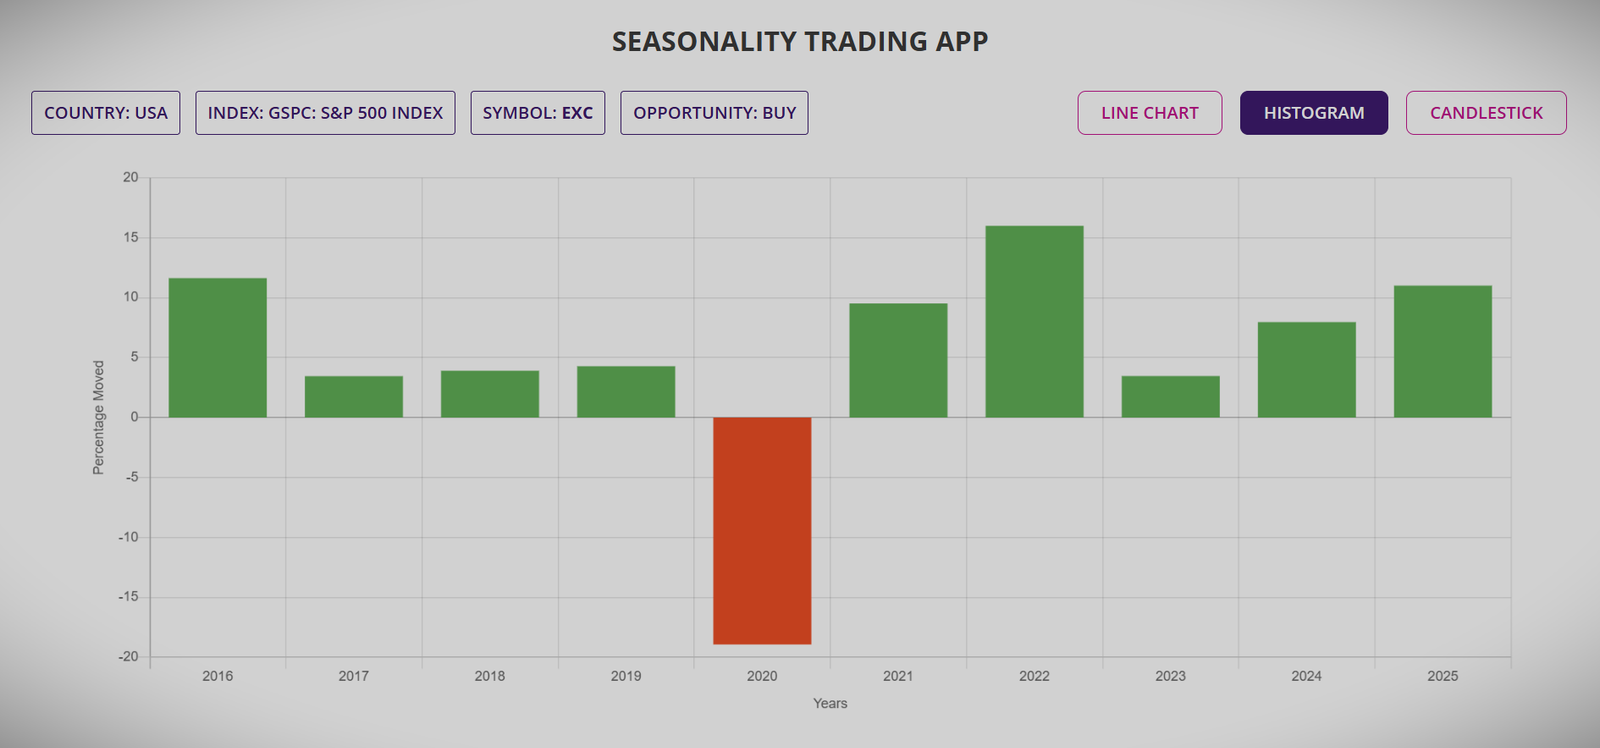
Histogram chart provides a snapshot of how much the underlying price moved, as percentage, in each year for the entire analysis year.
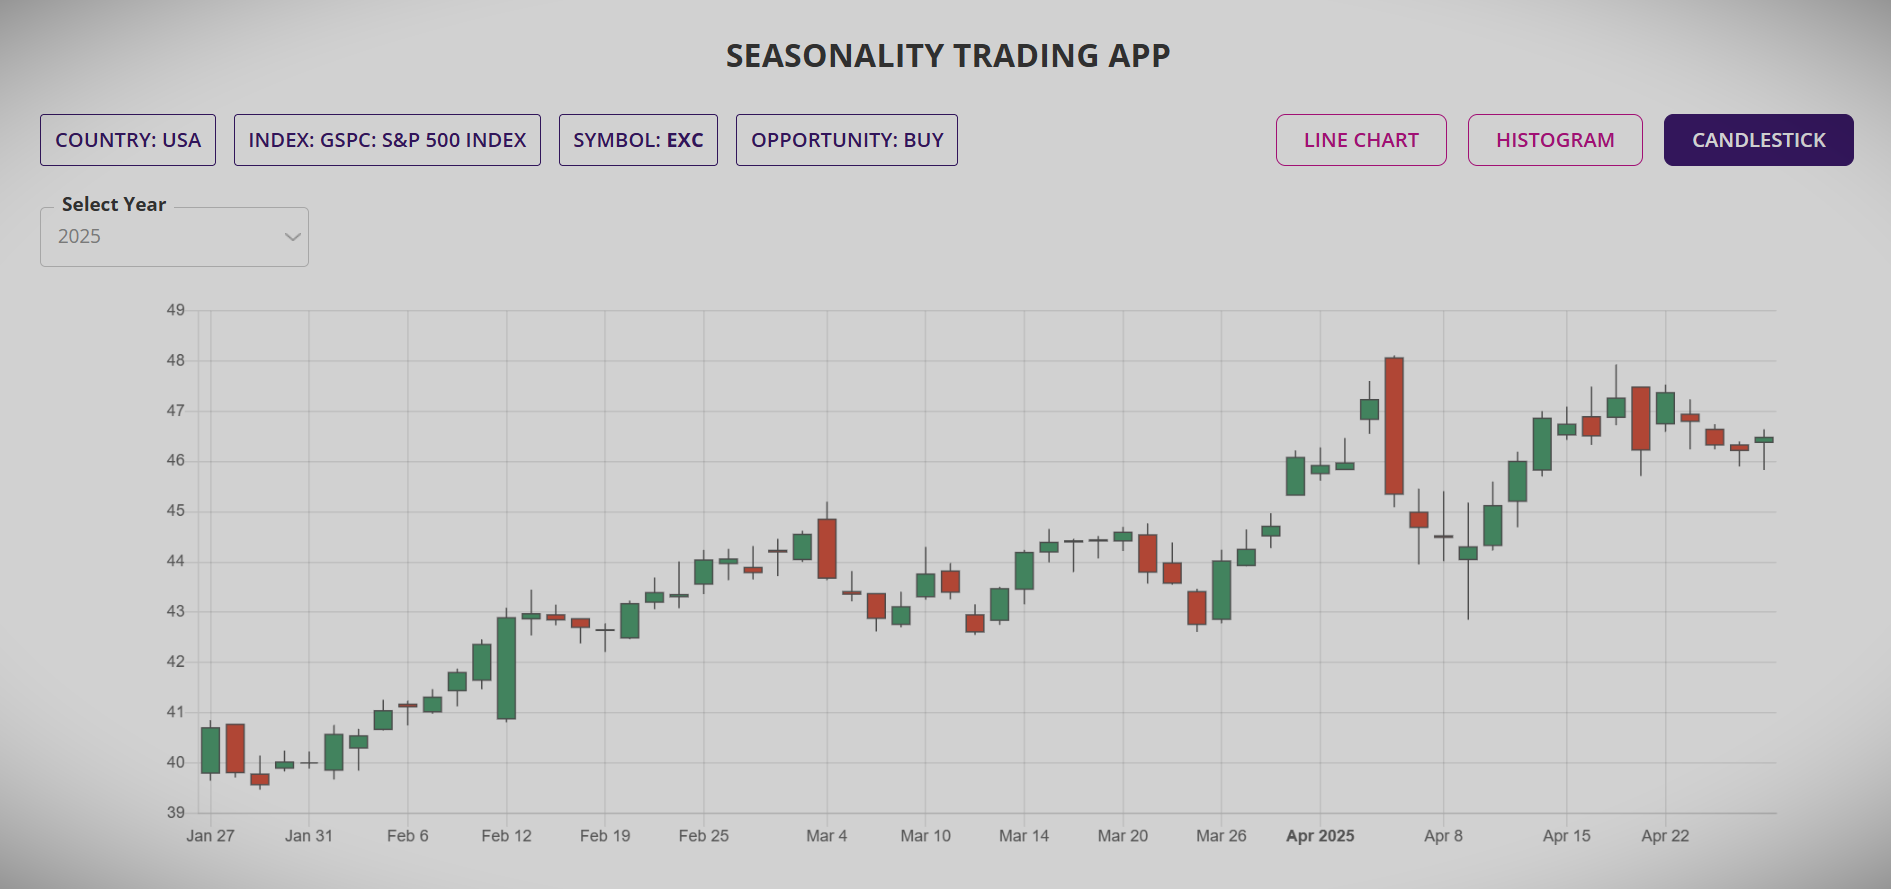
And finally, the candlestick chart of the underlying for the duration of the trade. The interactive chart allows to pick any year of choice from the years in history for which the app was run.
All these put together are designed to provide you with the best insight possible so that well-informed decision could be made in terms of Probability and potential Reward-Risk Ratio achievable in the trade.
Trading Seasonality Is As Simple As You Would Like It To Be
Trading Seasonality is simple. Once the underlying Stock or ETF is selected from the summary and detailed report, you could trade the underlying Stock or ETF as it is, either in form of simple BUY and SELL or in form of derivatives such as BUY and SELL of CFDs or Options.
In countries where derivative trading is not allowed, you may buy or sell the underlying Stock or ETF with strict profit and loss targets and let the trade play out. The trade may be closed once either of the targets is reached or may be managed by taking profit for half of holding of the underlying and letting the other half run with the possibility for even higher profit.
The same principles may be used for CFD trading but with a guaranteed stop to minimize the risk in the event of an adverse move of the underlying. For Options trading, it could be little complex as there are multiple ways in which the information could be traded, either as a single Option or as a multi-leg Option using two or three, or four legs. A debit spread is a great strategy in which you could manage your risk much better.
As always, for any trader, protection of trading capital is of paramount importance. So you will always need to follow strict money management principles, allocate only a portion of capital in any trade, and most importantly, employ a better than 2: 1 reward-risk ratio.
Please visit the tutorial page on how to use the app and also go to the video blog‘s tutorial section to watch the app in action. Additionally, you could register yourself in one of our periodic information sessions, if you would like to know more about the app, how to use it or anything else related to it.
You could also email us at admin@sapphirecapitals.com with any of your queries or send a message or chat with us using WhatsApp by clicking the icon at the lower right side of your computer or smartphone screen.
Which Country's Stocks And ETFs Do You Support?
Seasonality trading app is currently available for all the Stocks in the major Indices and ETFs of the following countries in four continents:
Asia: India, Singapore, Philippines, Japan, Hong Kong, Taiwan, Malaysia and China;
Europe: UK, Germany, France, Austria, Italy, Poland, Netherlands, Sweden, Switzerland, Spain, Portugal, Norway, Luxembourg, Ireland, Greece, Finland, Denmark and Belgium;
Oceania: Australia and New Zealand; and
The Americas: USA, Canada, Brazil, Chile, Mexico and Peru;
This makes up to about 45,000 Stocks and ETFs across 150 indices in 36 countries.
FAQs
No, Seasonality is a web-based trading app for you to perform research and find Stocks and ETFs meeting your criteria. It provides “Confidence” as a proxy for Probability based on various input criteria you will provide. Please watch the tutorial video for better understanding of how the trading app works.
You will need a computer with web browser, internet connection and subscription of the services to access the app. It is recommended that you bookmark the URL in your browser for ease of accessing.
Please note that there is no software download and installation required.
You may run the app as often as you like, there are no set or preferred time. It is recommended that you run this app during the weekend as the summary reports provide Stock and ETF to trade on the following Monday or the first trading day of the week and lists those by week number.
At any instant of time, you may run the trading applications for all the Stocks or ETFs of one Index of one country only. As an example, you pick the country as UK, then you can run the report for all the Stocks of one of the indices, such as FTSE100 or FTSE250. On completion of that report, you may run the application again for the US Stocks in Indices such as DOW30 or S&P500.
* Please read the Critical Subscription Information Summary below for details
Critical Subscription Information Summary
After the trial period, your account will be automatically charged for monthly subscription fee. This is a RISK-FREE trial, meaning, if you cancel anytime within 7 days of starting your subscription, you will not be charged. Subscription is month by month, cancel anytime.
A special discount of 50% on subscription fee is currently on offer to new subscribers only. There is no coupon code required, discount will be automatically applied at check-out.
Your Monthly Subscription Fee Is $39
Or equivalent in AUD, EUR, GBP and INR
Your monthly subscription fee covers:
1. Access to the app 24 X 7 and 365 days a year except for scheduled maintenance period or time taken to resolve any technical issues;
2. Access to analysis of more than 45,000 Stocks and ETFs across 150 indices in 36 countries across four continents: Americas, Asia, Europe and Oceania.
3. Additional access to Optionable Stocks and ETFs and other underlyings of special attributes across as many countries, more being added;
4. 24 X 7 customer support via email and Whatsapp (24 hours turnarond time) and FREE access to periodic webinars on trading strategy, technology and any other business!
In case you are worried about the value you get and whether or not you are satisfied with that, we thought we would let you know the following:
- The subscription fee can be recovered in one single small trade every month;
- The subscription fee is less than the hourly call out fee of any professional (such as plumber, electrician, handyman etc.) in developed or developing country;
- The subscription fee is also less than the price of a daily cup of tea/coffee for a month; and
- The subscription fee is the minimum to keep our servers, support and services running; remember, we are traders too and managing our own fund is our main business.
If for some reason, it is not for you, cancel anytime, you will not be charged from the following month.
Want To Know More About Our Other Awesome Trading Apps?
Click The Boxes Below And Try These RISK-FREE For 7 Days
Two For Three Offer:
Subscribe all three swing trading apps (Seasonality, Volume spike and Price action) and we will refund subscription fee for one every month (does not apply for Intraday Seasonality day-trading app)
Disclaimer
Trading in Financial markets has large potential rewards, but also large potential risk. You must be aware of the risks and be willing to accept them in order to trade. Don’t trade with money you can’t afford to lose. This is neither a solicitation nor an offer to Buy/Sell any of the financial instruments mentioned in Sapphire Capital’s trading apps.
No representation is being made that any account will or is likely to achieve profits or losses similar to those shown. The past performance of any trading system or methodology is not necessarily indicative of future results.
The information provided by the trading apps is for educational and research purposes only and are not intended to provide financial advice. Any statements about profits or income, expressed or implied, do not represent a guarantee. You accept full responsibilities for your actions, trades, profit or loss, and agree not to hold the Sapphire Capitals responsible in any and all ways.
Sapphire Capitals is NOT a financial services company as defined by the Australian Securities and Investment Commission (ASIC) or any similar organisation anywhere else in the world as:
- We do not provide financial product advice to our customers;
- We do not deal in a financial product such as buying or selling shares on behalf of a client or issuing interests in a managed investment scheme;
- We do not make a market for a financial product; and also
- We do not operate a registered managed investment scheme.