
Are You Overlooking Spikes In Trading Volume? Uncover Institutional Footprints Behind Sudden Volume Spikes; Analyze Volume Anomalies To Build Structured Data-Backed Trading Strategies For Positive Expectancy**
Automate Volume Anomaly Research: Screen High-Volume Price Patterns, Historical Recurrence Odds, and Reward-Risk Ratios (RRR) Powered by Advanced Data Analytics
Join A Growing Global Community Of Systematic Traders And Market Analysts
*Please read the Critical Subscription Information Summary at the bottom for details
Expectancy Is Strongly Positive When Trades Are Taken With Confirmation Of Intent i.e. Trading Volume Spikes
**Positive expectancy does not mean every trade wins. It means analysing whether historical reward potential has exceeded historical risk across a series of trades.
Instantly Screen Hundreds of Equities for Unusual Volume Activity with One Click and Filter Candidates Based on Custom Backtested Criteria!
Are you watching unusually high trading volumes of certain Stocks & ETFs? If you are studying financial markets, then you should be aware about what institutional investors (the likes of Banks and other financial institutions) and top hedge fund managers (the likes of Bridgewater, Renaissance Technologies and Blackrock) are Buying and Selling?
It’s not just the trading volume itself but identifying any sharp rise in daily trading volume, also called Volume spike, and the following price action pattern that matters the most. That’s the key to learning what’s going on in the market, which Stocks and ETFs have the attention of the institutional investors and large hedge fund managers and which among those Stocks and ETFs are bought and sold in large volumes that can set off large BULLISH or BEARISH moves.
Sounds fascinating? Please read on!

For Those Discerning Traders Who Would Like To Be On Top Of What Market Volume Is Doing
Remember, a very large section of traders and investors are playing without knowing the rules of the game and their decisions, more often than not, are based on hunch or recommendations by someone or some newsletter or some source of news. But, if you are among the ones who would like to first study the financial markets and make trading decisions based on sound mathematical and statistical models, then you would be looking to use appropriate tools for historically analysing the market for volume spikes and the price action that follows for positive expectancy opportunities.
Daily trading Volume of a Stock or ETF often goes un-noticed, yet, it carries some of the most valuable information for a trader. It is often an obscure piece of information in the technical chart of a Stock or ETF that is often not visible unless enabled by the user. A sharp increase of trading volume or a Volume spike is one very important event for a trader to be aware of while making trading decisions if you would like to put Probability on your side or looking for trades with positive expectancy.
Let us explain how.

Where To Find The Most Credible Information About Trading Volume and Why Should You Care As Most Traders Just Don't
A Volume spike is indicative of buying and selling frenzy and there could be two reasons for that. Large financial institutions or Smart money managers such as investment banks or large hedge funds are either buying or selling the underlying Stock or ETF. These two possible scenarios could have one of the three possible implications in terms of the movement of the underlying Stock or ETF price.
- UP: the underlying Stock or ETF could go up if the volume spike is caused by buying frenzy by the institutional investors as they anticipate increased performance of the underlying Stock or ETF;
- DOWN: the underlying Stock or ETF could go down if the institutional investors are off-loading their holdings either because of profit taking or in anticipation of poor performance of the underlying Stock or ETF;
- SIDEWAYS: the underlying Stock or ETF price could trade in a narrow range with no significant movement in either direction!
There has been a lot of research in universities around the world by students and academicians on Volume spike as a highly credible trading strategy. We relied heavily on those research papers and real life trading experience in designing our algorithm behind the Volume spike trading app.
Please email info@sapphirecapitals.com if you would like to read some of those research papers.

Things You Need To Know About Volume Spike
Just knowing the existence of a Volume spike is not good enough. How about knowing the complete historical performance of past Volume spikes of all Stocks and ETFs and finding out how many times those spikes were followed by large moves UP or DOWN, the size of the moves and number of trading days it took to get to those HIGH or LOW levels?
Here are few examples of what usually follows a Volume spike and Probability of recurrence of those patterns:
- 3X Spike in average daily trading volume of Boral Ltd (ASX: BLD) was historically followed by a gain in the stock price of over 10% in next 15 trading days 90% of the time in last 5 years;
- 4X Spike in daily trading volume of Alphabet Inc. (NASDAQ: GOOG) was historically followed by a decrease of an average of over 6.7% in stock price in the following 30 trading days 80% of the time in last 5 years;
- 4X Spike in trading volume of Eicher Motors Ltd. (NSE: EICHERMOT) was historically followed by a gain in Stock price of over 14% in the following 39 days 83% of the time in last 5 years.
*(Disclosed historical Data: historical performance is presented for educational and illustrative purposes only. Past performance is not indicative of future results.)
If the Volume spike followed a large move 90% of the time in past, that means there is 90% Probability of the underlying Stock or ETF of making similar large move when the next Volume spike occurs in future.
That is where the data science and cloud computing technology comes handy as we leverage research-backed algorithm to analyze historical data and bring the results as delivered by our Volume spike trading app. This is the scientific way of making trading decisions based on hard evidences from years of historical data and not based on any hunch!

Obtain Detailed Visibility And Full Understanding Of The Key Parameters Of Interest In A Volume Spike
- Look back in history for up to 5 years of data
- Find opportunities for your desired level of historical success of trades for Probability
- Find out historical HIGHs and LOWs of the Stock following each past volume spike events
- Find out the historical time taken for the Stock to reach those HIGHs and LOWs
- Both trading opportunities covered: LONG (BUY) & SHORT (SELL)
- Pick all the Stocks in the Index of your choice or single Stock or ETF for analysis
- Summary report providing all available opportunities meeting your criteria
- Detailed report providing results for each historical volume spike event
- Complete trade performance for the number of years analysed
- Includes total profit, maximum consecutive wins and such key parameters
- Three charting function built-in for better visibility
- Candlestick and histogram for better insight of historical results
* Please read the Critical Subscription Information Summary at the bottom for details

We Have Designed The User Interface For Simplicity And Ease Of Use
Select the country, select the index of the country you are interested in, type in the minimum size of the Volume spike you are looking for, select whether you are looking for Long or Short opportunities, select the analysis start year (year since), type in the lookback period and finally what minimum confidence or minimum probability of success of the patterns are you looking for.
Confidence is the percentage of the number of historically successful outcome of the patterns (moved up for BUY trades or moved down for SHORT trades) to the total number of Volume spike patterns during the years of analysis. This is also the Probability of the recurrence of the pattern. As an example, a confidence of 90% means that Stock or ETF price had moved in the desired direction in 9 out or last 10 times after the Volume spike had occured or 18 out of 20 times. So, there is 90% Probability of the pattern occuring again next time.
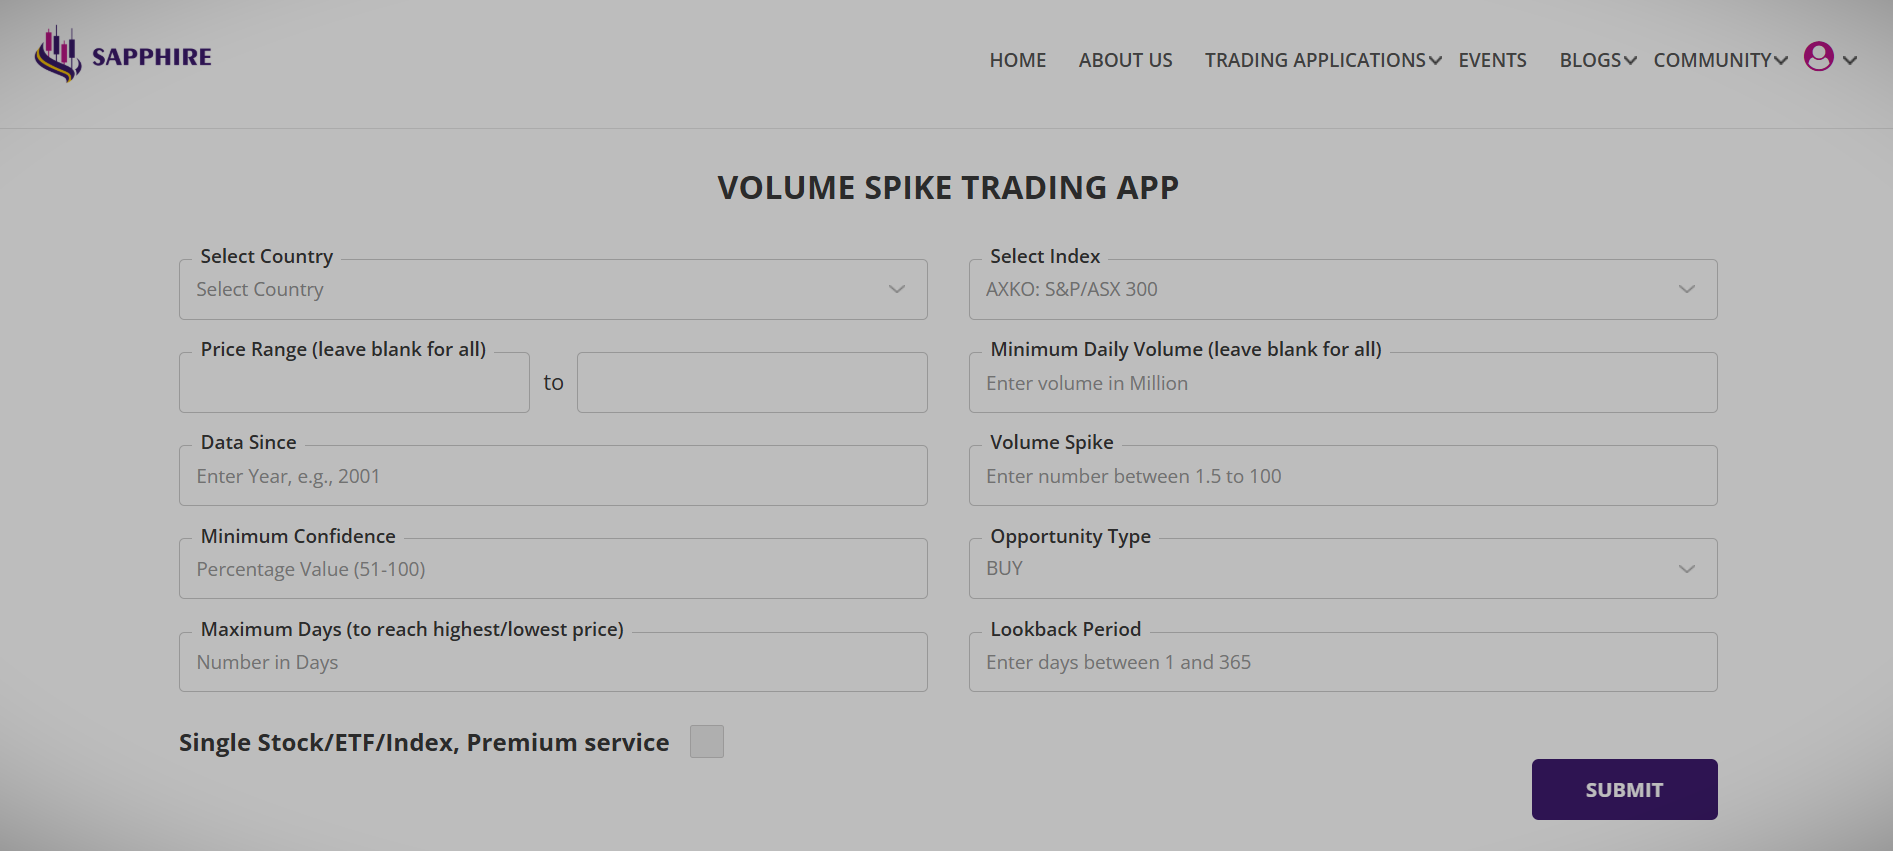
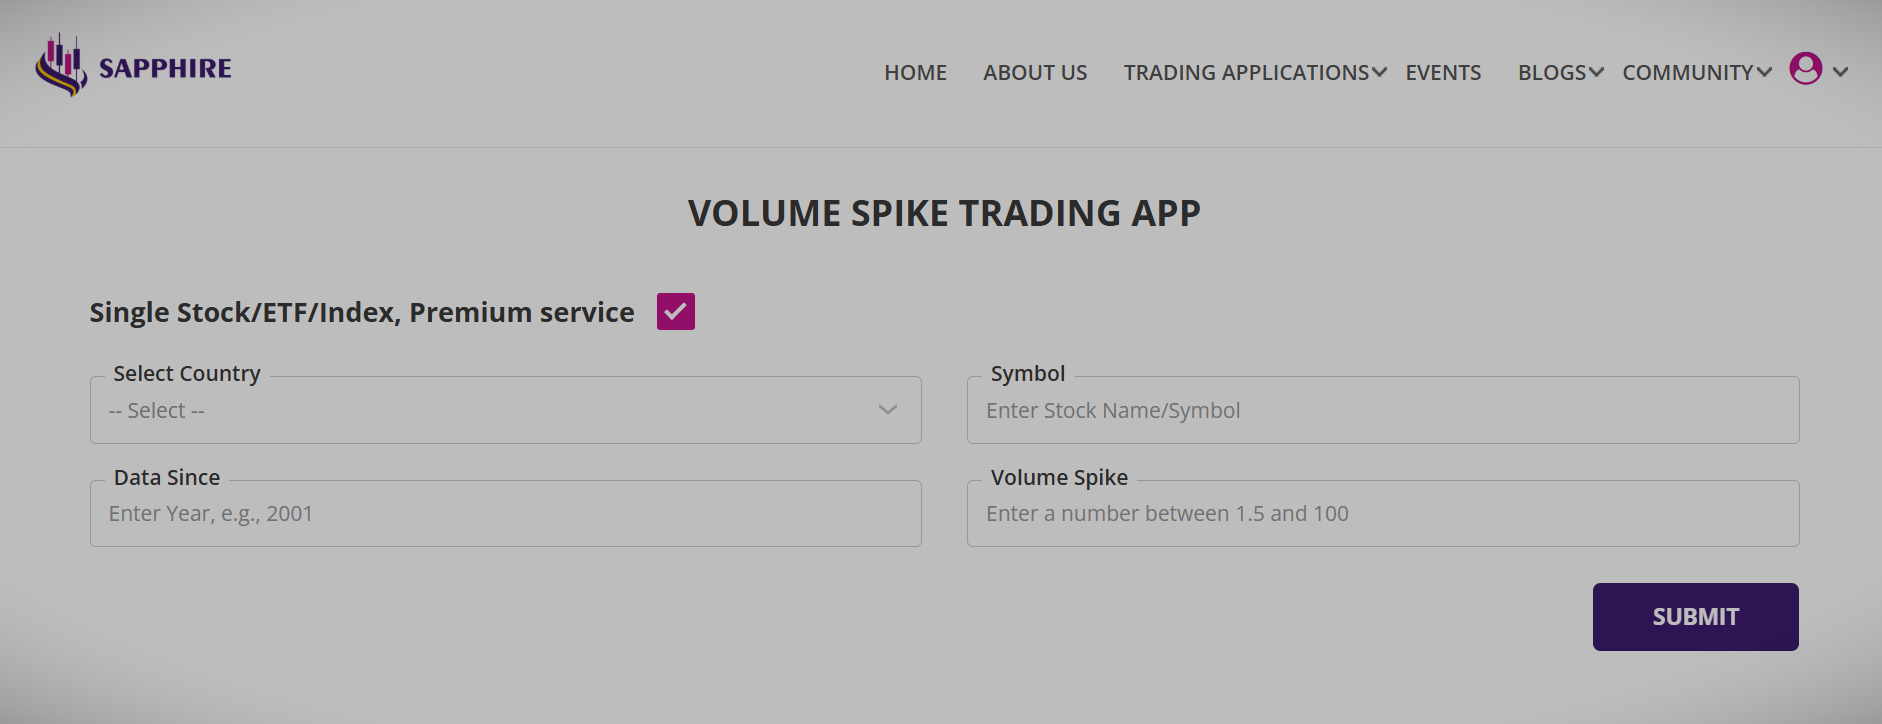
You could also look for the Volume spike patterns in Single Stock or ETF via the alternative Single Stock/ETF/Index, Premium service input screen.
The Summary And Detailed Reports Have Been Designed with Your Ease Of Use In Mind
With the user selection of the country and index, look back period, minimum required confidence, the Volume spike trading app begins to look into the stock database for recent and past Volume spikes and patterns around it to produce a summary report of all available opportunities. The summary report provides all possible open and closed trades with dates of occurence of Volume spikes and parameters of interest such as confidence, average move up, average move down, the time taken to reach those levels or average days held and couple other proprietary parameters.
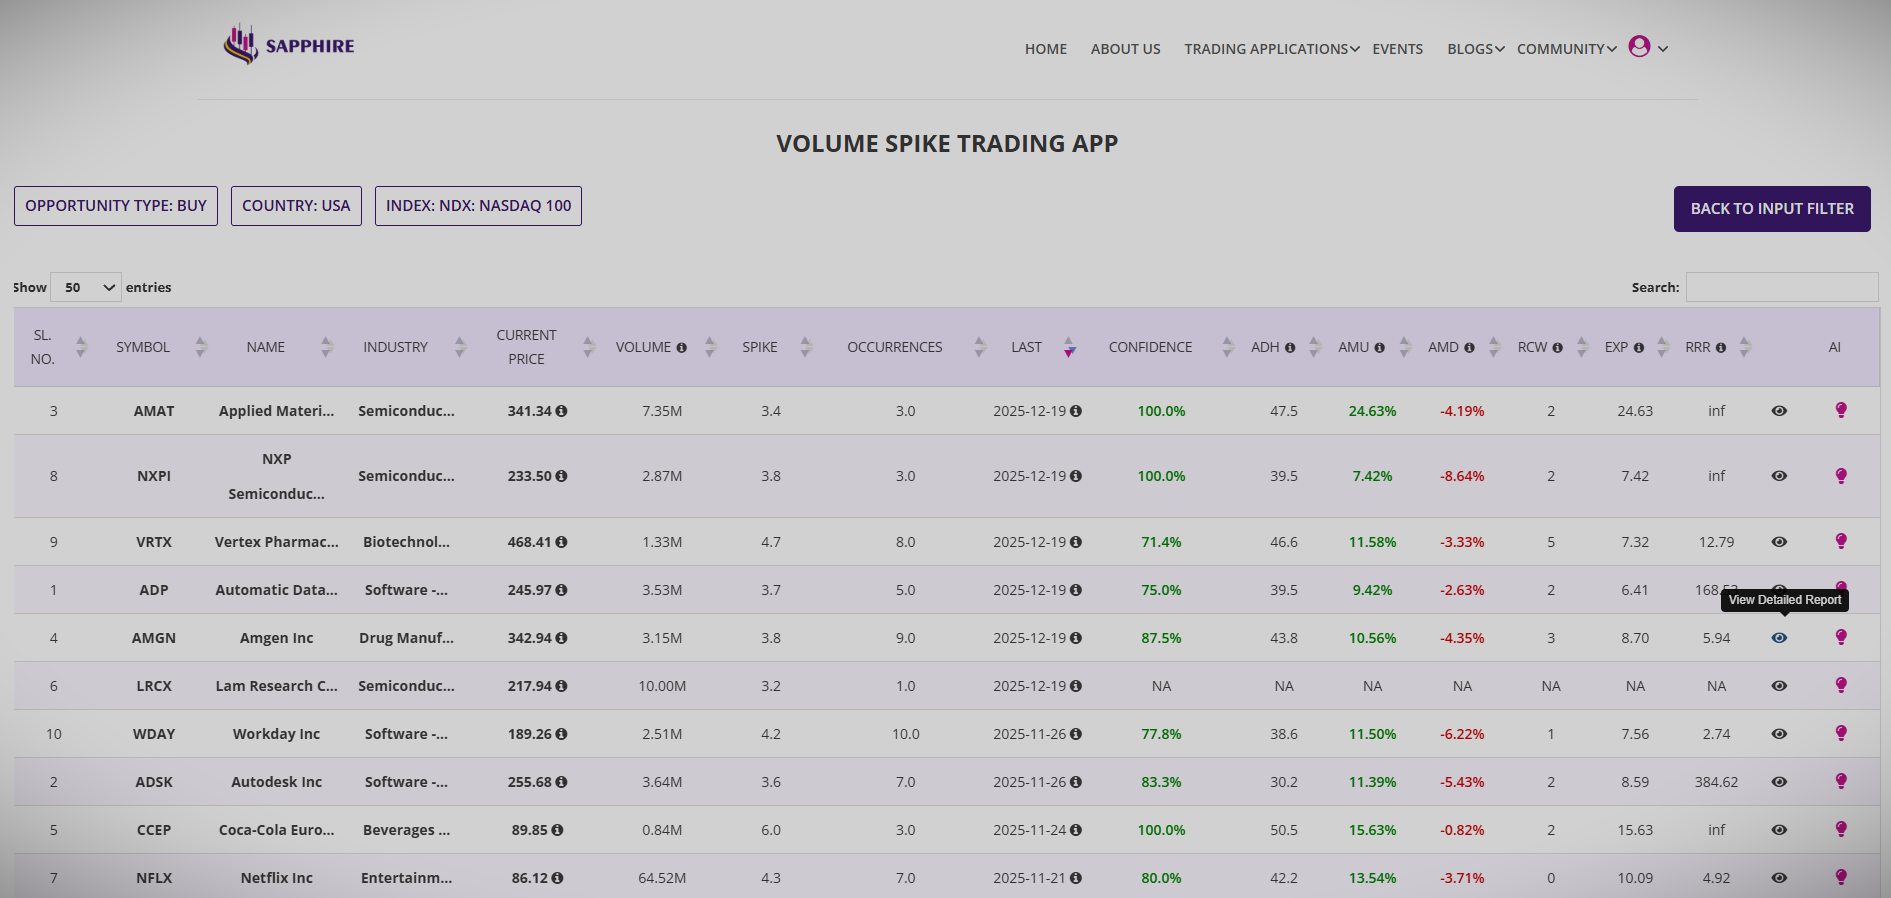
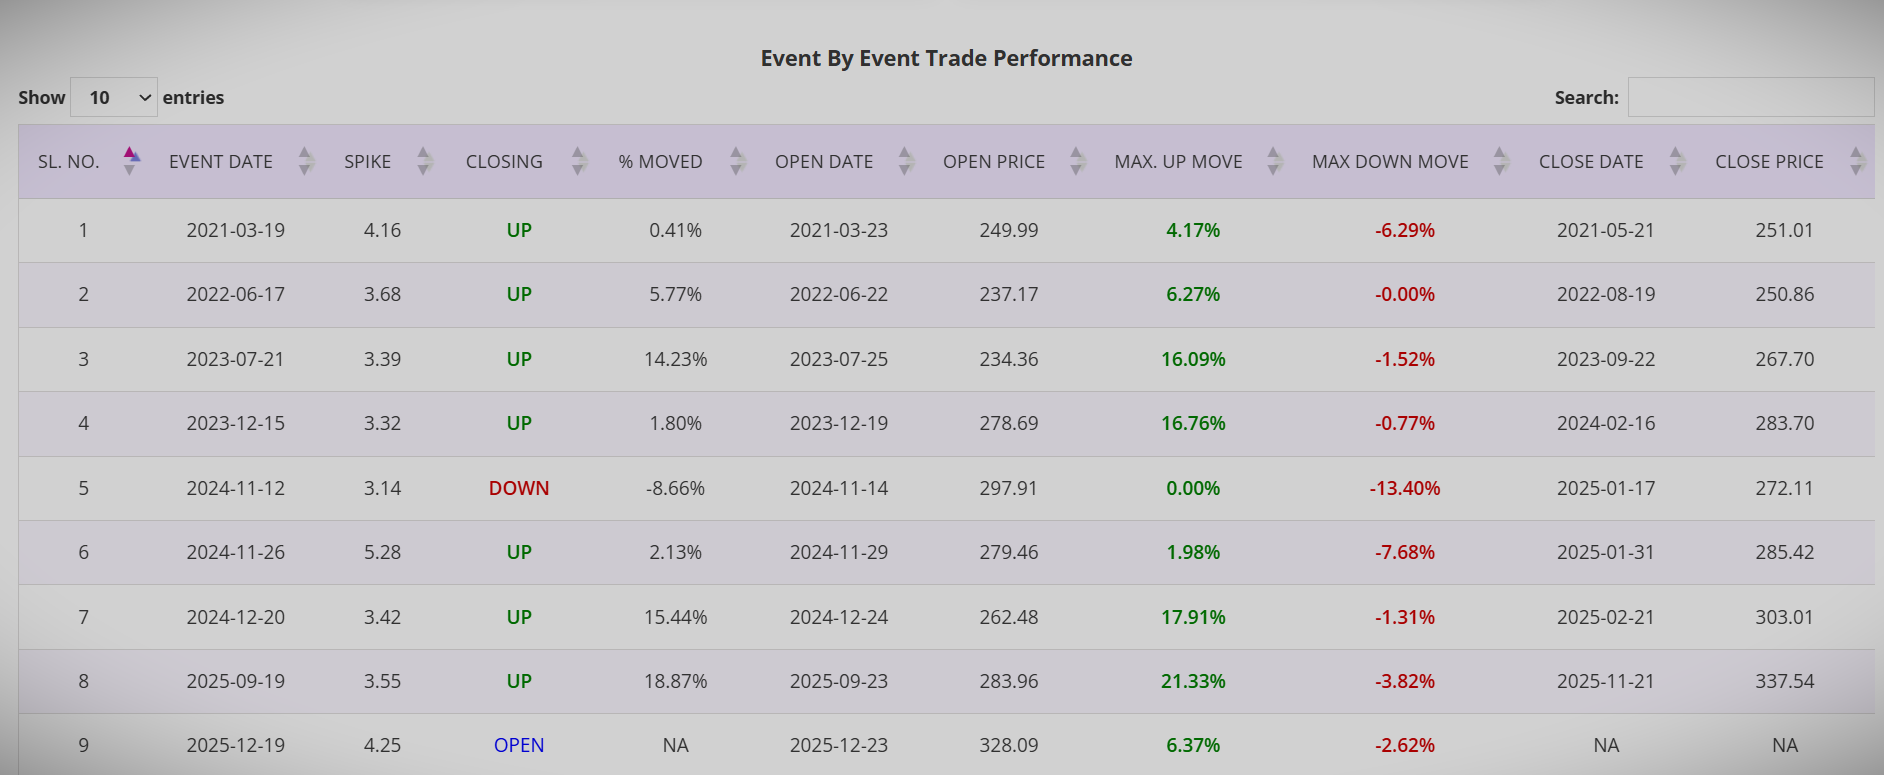
Each of the Stocks or ETFs listed in the summary report can be drilled down to a detailed report. The detailed report has two tables, the one at the top contains the aggregated trade performance for the number of Volume spikes occured during the period of analysis. There are several parameters of interest included such as maximum consecutive wins, winning percentage, gross profit, net profit and reward-risk ratio (RRR).
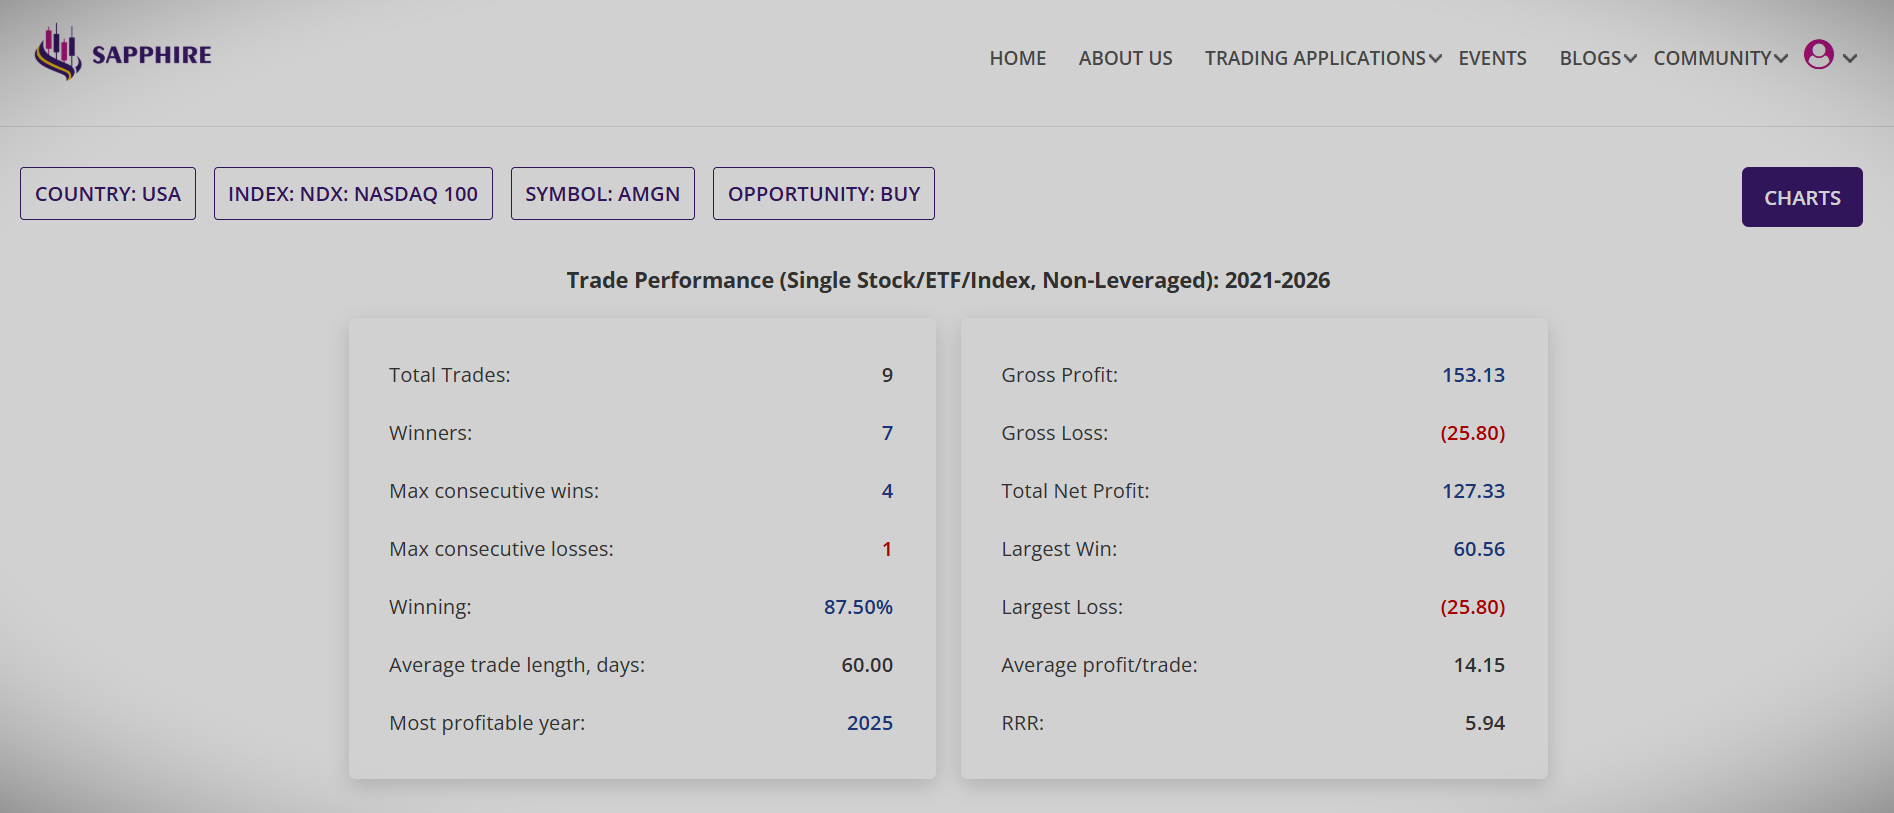
The bottom section of the detailed report provides historical trade performance for each of those Volume spikes with a range of information including maximum move up, maximum move down and closing price. You may slice and dice the numbers in the detailed report about whether or not a recent Volume spike is tradable; and if yes, what to expect in terms of the drawdown and average move in favour.
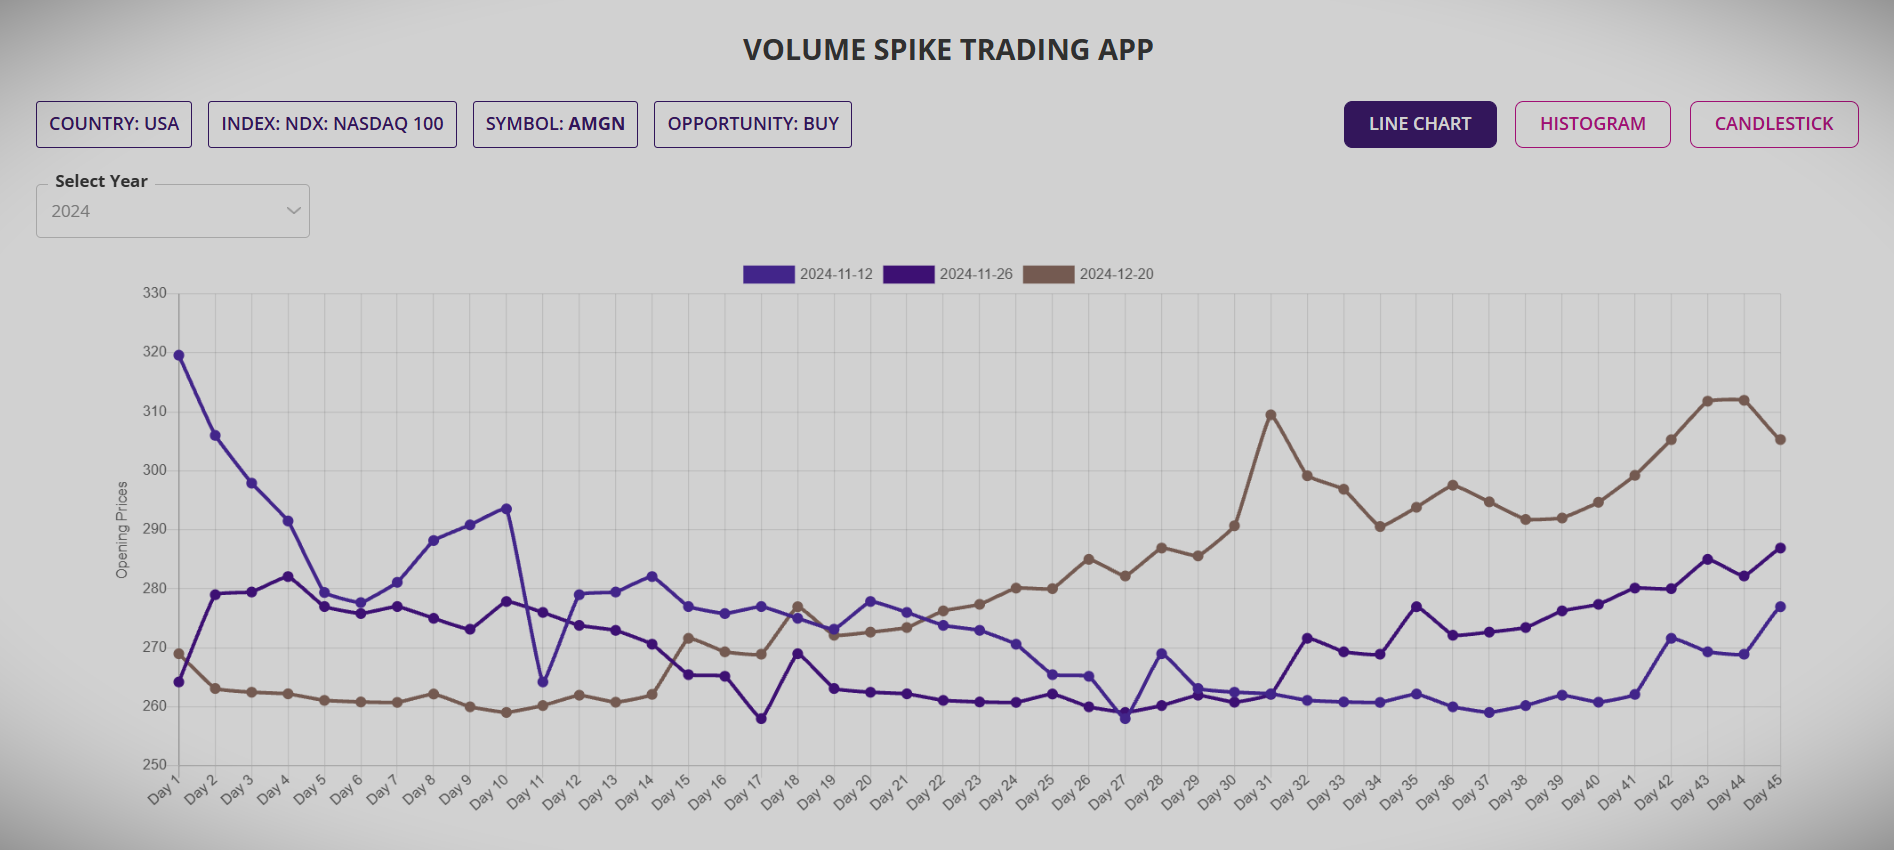
The interactive charting options provide even better insight into each of the past Volume spikes. The line chart summarises all the events for each year of analysis and how the underlying price moved after the Volume spike.
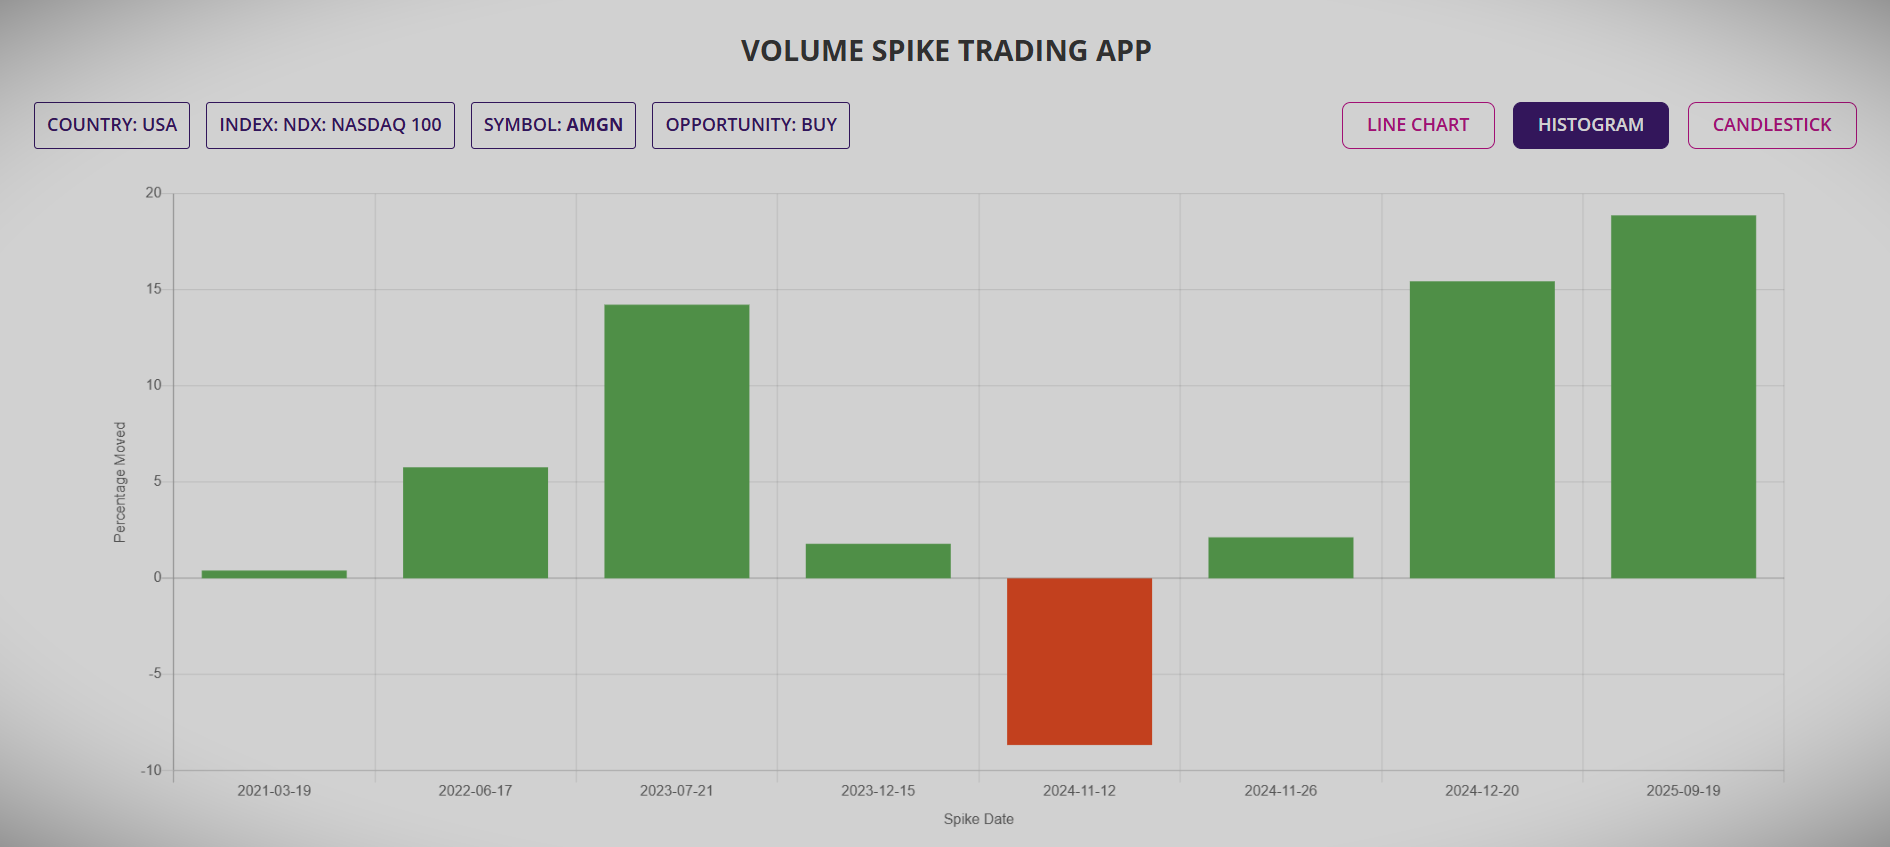
Histogram chart provides a complete picture of all historical Volume spikes for the number of years analysed and the percentage movement of the price in each of those events.
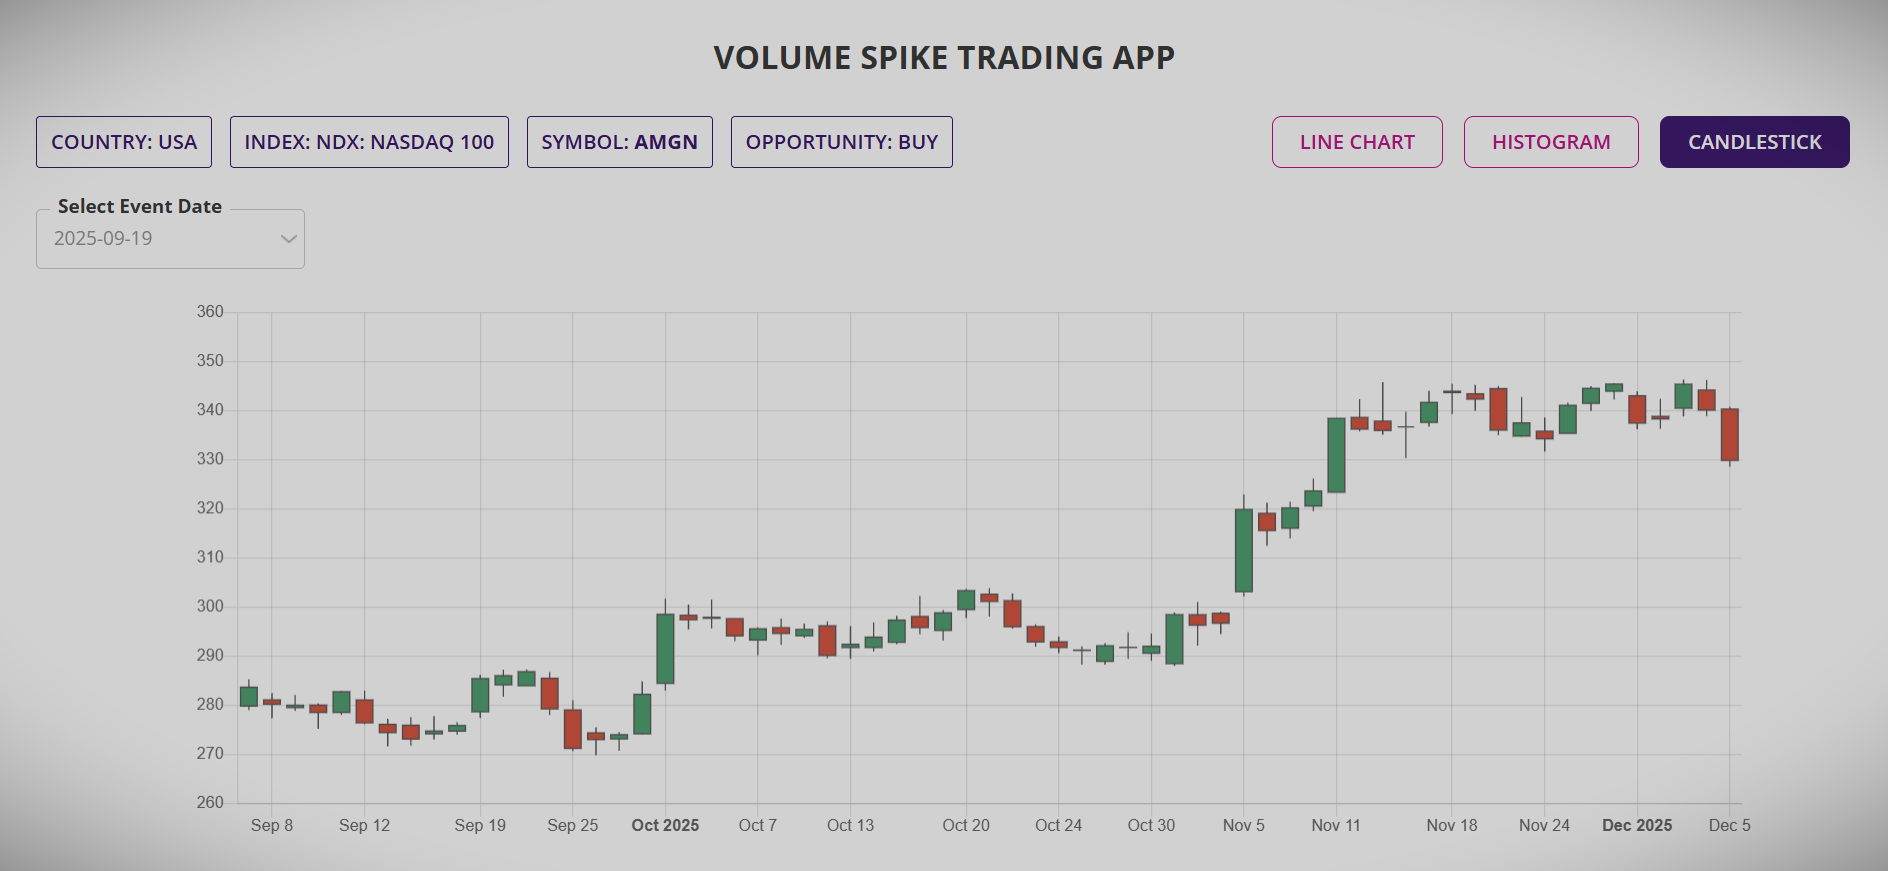
And finally, the classic candlestick chart to provide the real price action following each Volume spike for the number of years analyzed.
All these put together are designed to provide you with the best insight possible for Probability and potential Reward-Risk Ratio.
Trading Volume Spike Is As Simple As You Would Like It To Be
Once the underlying Stock or ETF is selected from the summary and detailed report, you could trade as it is, either in form of simple BUY and SELL or in form of derivatives such as BUY and SELL of CFDs or Options.
In countries where derivative trading is not allowed, you may buy or sell the underlying Stock or ETF with strict profit and loss targets and let the trade play out. The trade may be closed once either of the targets are reached or may be managed by taking profit for half of holding of the underlying and let other half run with possibility for even higher profit.
Same principles may be used for CFD trading but with guaranteed stop to minimise the risk in the event of an adverse move of the underlying. For Options trading, it could be little complex as there are multiple ways in which the information could be traded, either as a single Option or as multi-leg Option using two or three or four legs. Debit spread is a great strategy in which you could manage your risk much better.
As always, for any trader, protection of trading capital is of paramount importance. So you will always need to follow strict money management principles, allocate only a portion of capital in any trade and most-importantly, employ better than 2:1 reward-risk ratio (RRR).
Please visit the tutorial page on how to use the trading app and also go the video blog‘s tutorial section to watch app in action. Additionally, you could register yourself in one of our periodic information session, if you would like to know more about the trading app, how to use it or anything else related to the app.
You could also email us at admin@sapphirecapitals.com with any of your queries or send message or chat to us using WhatsApp by clicking the icon at lower right side of your computer or smartphone screen.
Which Country's Stocks And ETFs Do You Support?
Volume spike trading app is currently available for all the Stocks in the major Indices and ETFs of the following countries in four continents:
Asia: India, Singapore, Philippines, Japan, Hong Kong, Taiwan, Malaysia and China;
Europe: UK, Germany, France, Austria, Italy, Poland, Netherlands, Sweden, Switzerland, Spain, Portugal, Norway, Luxembourg, Ireland, Greece, Finland, Denmark and Belgium;
Oceania: Australia and New Zealand; and
The Americas: USA, Canada, Brazil, Chile, Mexico and Peru;
This makes up to about 45,000 Stocks and ETFs across more than 150 indices in 36 countries.
FAQs
No, Price Action Trading application is a web-based trading application for you to perform research and find Stocks and ETFs meeting your criteria. It provides “Confidence” as a proxy for Probability based on various input criteria you will provide. Please watch the tutorial video for better understanding of how the trading application works.
You will need a computer with web browser, internet connection and subscription of the services to access the trading app. It is recommended that you bookmark the URL in your browser for ease of accessing.
Please note that there is no software download and installation required.
You may run the app as often as you like, there are no set or preferred time. It is recommended that you run the app on all trading days four hours after the close of trading for the stock exchange of your interest.
At any instant of time, you may run the trading applications for all the Stocks or ETFs of one Index of one country only. As an example, you pick the country as UK, then you can run the report for all the Stocks of one of the indices, such as FTSE100 or FTSE250. On completion of that report, you may run the application again for the US Stocks in Indices such as DOW30 or S&P500.
* Please read the Critical Subscription Information Summary below for details
Critical Subscription Information Summary
After the trial period, your account will be automatically charged for monthly subscription fee. If you cancel anytime within 7 days of starting your subscription, you will not be charged. Subscription is month by month, cancel anytime.
Your Monthly Subscription Fee Is $39
Or equivalent in AUD, EUR, GBP and INR
Your monthly subscription fee covers:
1. Access to the trading app 24 X 7 and 365 days a year except for scheduled maintenance period or time taken to resolve any technical issues;
2. Access to analysis of more than 45,000 Stocks and ETFs across 150 indices in 36 countries across four continents: Americas, Asia, Europe and Oceania.
3. Additional access to Optionable Stocks and ETFs and other underlyings of interest across as many countries, more being added;
4. 24 X 7 customer support via email and Whatsapp (24 hours turnarond time) and FREE access to periodic webinars on trading strategy, technology and any other business!
In case you are worried about the value we are offering and whether or not it is for you, we decided to make it a no-brainer decision for you:
- The subscription fee can be recovered in one single small trade every month;
- The subscription fee is less than the hourly call out fee of any professional (such as plumber, electrician, handyman etc.) in a developed or developing country;
- The subscription fee is also less than the price of a daily cup of tea/coffee for a month; and
- The subscription fee is the minimum to keep our servers, support and services running; remember, we are traders too and managing our own fund is our main business.
If for some reason, it is not for you, cancel anytime, you will not be charged from the following month.
Want To Know More About Our Other Awesome Trading Apps?
Click The Boxes Below And Try These For 7 Days
Disclaimer
Trading in Financial markets has large potential rewards, but also large potential risk. You must be aware of the risks and be willing to accept them in order to trade. Don’t trade with money you can’t afford to lose. This is neither a solicitation nor an offer to Buy/Sell any of the financial instruments mentioned in Sapphire Capital’s trading apps.
No representation is being made that any account will or is likely to achieve profits or losses similar to those shown. The past performance of any trading system or methodology is not necessarily indicative of future results.
The information provided by the trading app is for educational and research purposes only and are not intended to provide financial advice. Any statements about profits or income, expressed or implied, do not represent a guarantee. You accept full responsibilities for your actions, trades, profit or loss, and agree not to hold the Sapphire Capitals responsible in any and all ways.
Important Global Regulatory & Financial Risk Disclosures:
General Information Notice (ASIC RG 244 / Corporations Act 2001): Sapphire Capitals provides apps and educational content strictly for general research purposes. These app do not provide personal financial advice, financial product recommendations, or manage client funds. Please evaluate whether these apps align with your individual financial position or consult an Australian Financial Services Licence (AFSL) holder or qualified financial advisor.
International Risk Warning (SEC / CFTC / FCA): Financial market trading carries significant financial risk and is not suitable for every investor. Historical backtests and probability statistics do not guarantee future market behavior.
Prudential Notice (APRA): Sapphire Capitals is a software technology company and is not an Authorised Deposit-taking Institution (ADI) regulated by APRA.